
PDF reports
Generating reports is a key part of any project, and SiteHive has a range of features to help just go to the Reporting / PDF Reports page.
These include:
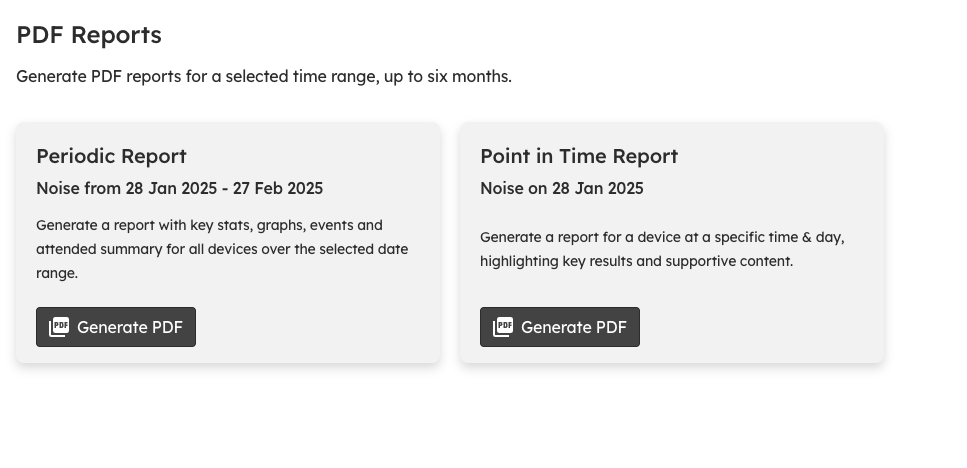
Periodic reports: Choose a data range to make weekly/monthly/quarterly reports
Point in Time reports for Noise: One pager for a specific time/location, usually in response to Noise complaints
Attended reports (SiteHive Enviro Pro Only): One pager summarising an in-person attended monitoring session - find more information on Advanced Reporting
Periodic reports
Periodic reports are the most comprehensive report type and are typically used for generating a report for any number of devices/locations, over periods of time from a week to 6 months.
Reports are generated for one aspect (noise/dust/vibration) at a time.
Periodic reports have a range of configurations available when you generate the report, including whether the report should contain:
Device List and Map: List of all selected devices and map showing their locations
Stats Cards: Cards highlighting key stats for the period, typically averages/maximums depending on the aspect
Telemetry Graphs: Graph per device/location, with configurable options including averaging period, showing thresholds, weather affected and/or out of hours periods
Weather Graphs: Graph your weather. Select your data source (OpenWeather, BOM, or your own weather station) to get rainfall, wind, temperature, humidity and dew point data
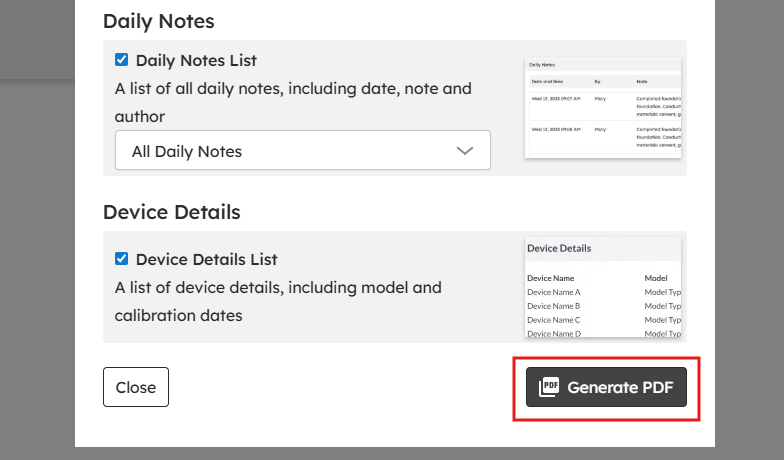
Daily Notes: You can select from the dropdown 'All Daily Notes' or 'Only Monitoring Point Related.' The list includes date, note and author.
Device Details: List of devices, showing make, model, calibration status etc
Attended Monitoring: Summary of all attended monitoring undertaken in the period
Your configuration settings will be saved automatically, so each time you come to generate a report the settings will be the same as last time.
Point in Time reports
Point in time reports are a quick and easy way to generate a one page summary to show what was happening at a specific date/time/location across your site.
Typically done retrospectively, and often in response to complaints (e.g. someone reckons there was loads of construction noise yesterday).
This report allows you to select a specific device out on site, and time, with the report then containing both context data (e.g. graph of data for the whole day), and specific results from that time (e.g. noise levels, images), and add your own commentary on site activities etc that may have been occurring.
When on the Reporting / PDF Reports page - select the Noise aspect and the option to generate a Point in Time report.

Asynchronous Reporting
SiteHive Enviro now generates reports asynchronously, meaning they are processed in the background and delivered via email. This lets you work uninterrupted while your report is being prepared, and allows analysis over longer time periods.
How does it help?
Extended visibility – analyse trends over a full year instead of just six months.
Zero downtime – no more waiting on the reporting screen; keep working while your report is generated.
Easy archive – your inbox keeps a historical log of every report you generate.
How does asynchronous reporting work?
Request your report
Select your parameters (e.g., aspect, dates, and monitoring points) as usual, then click Generate PDF.
Keep working
Once you hit Generate, you can navigate away or start other tasks within SiteHive Enviro.-
Check your email
When the report is ready, you’ll receive an email containing:Project details: name, project, aspects (noise, dust, vibration), and date range
Download link: a secure link to your report (expires after 7 days, but the URL remains valid)
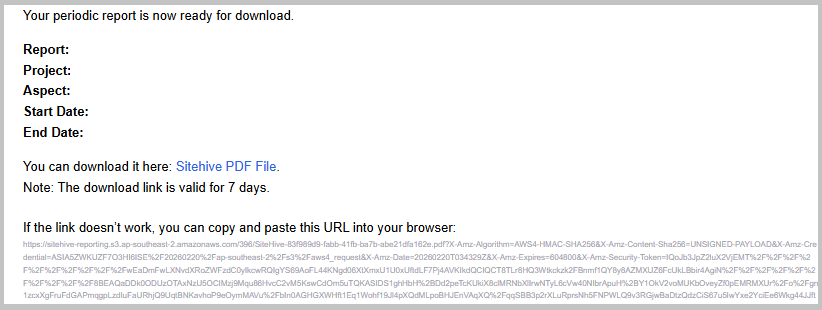
Download your report
Click the link or use the URL to save the file. Most browsers will automatically save it to your local downloads folder.
Note: If you don’t see the email, check your junk/spam folder and ensure no-reply@notifications.sitehive.co is on your safe sender list.
Explore SiteHive Enviro Reporting
For data exploration & investigation use Graph Data
To get high level stats & daily averages use Stats and Analysis
To make a comprehensive site report use Generate a PDF report
Or want simple data in an easy to use format use CSV Reports