
SiteHive Enviro - Start Here
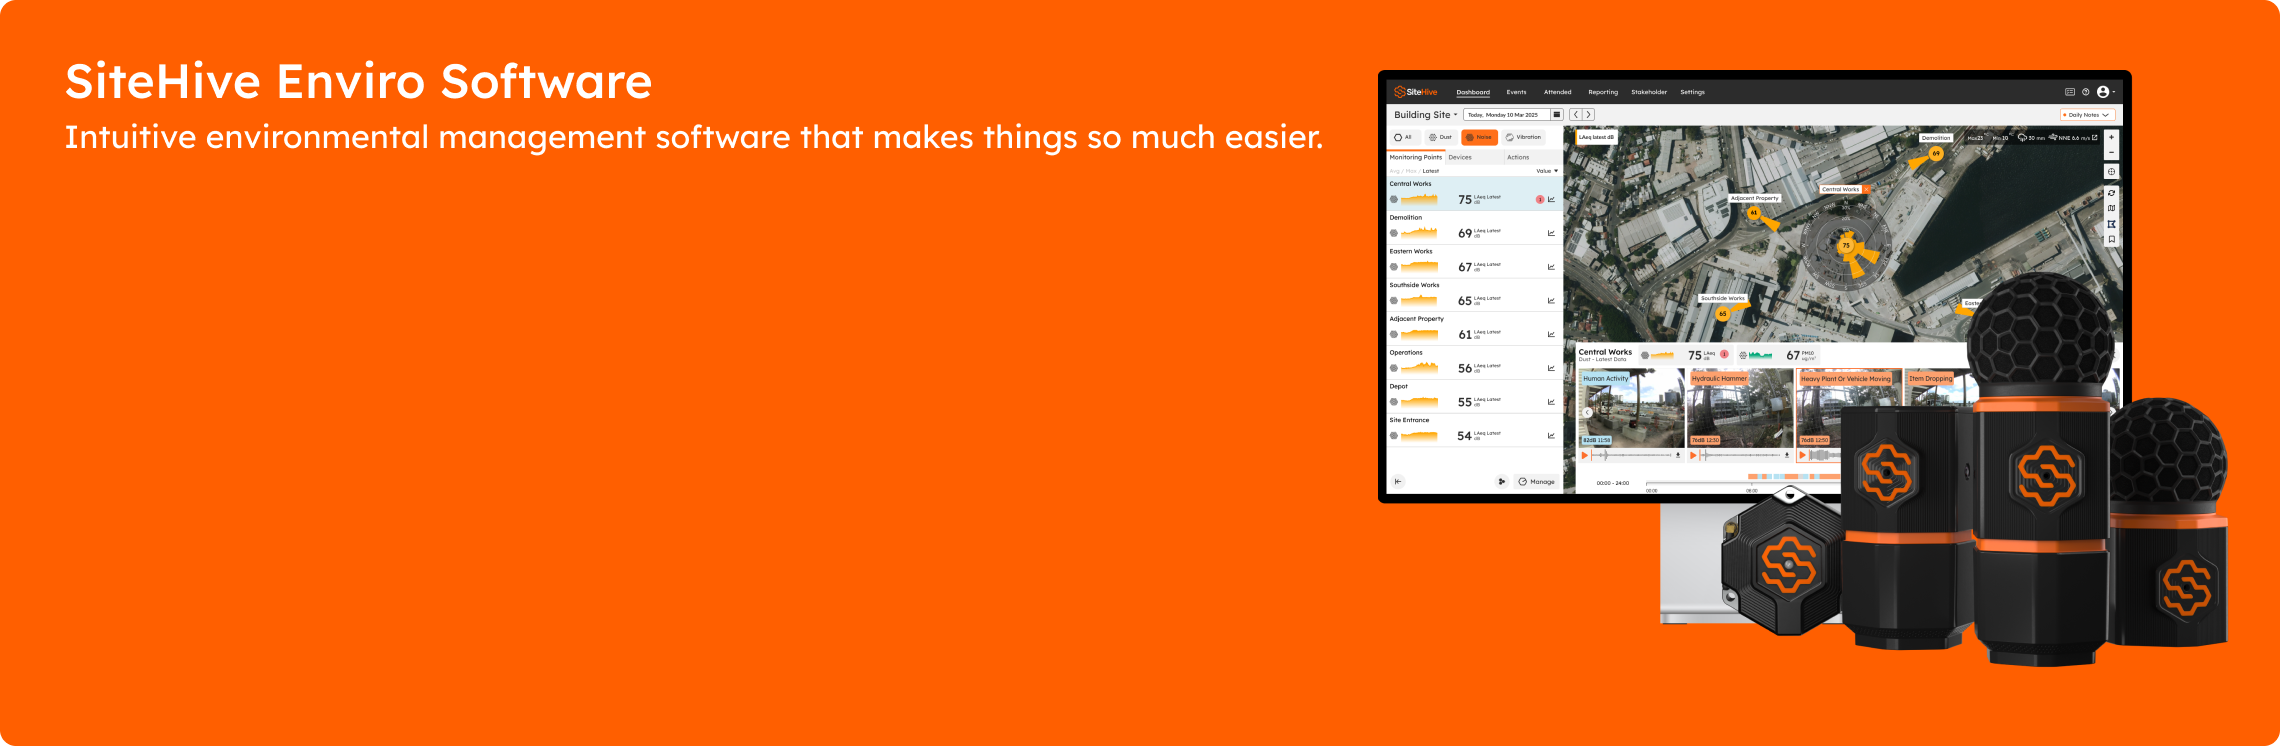
SiteHive Enviro makes it easy to see and manage what's happening across your site in real time - from wherever you are. You have the information you need to make confident decisions and act proactively. Intuitive and easy, you'll love using SiteHive to manage environmental impact.
New to SiteHive Enviro Software?
Get familiar with key features by completing these four quick steps:
- Set Up a Device – Have a new device on-site? Add it to SiteHive Enviro Software using Easy Setup, then manage all your devices and monitoring points from the Dashboard.
- Create Notifications – Need alerts? Create a Rule and configure email or SMS notifications in Settings > Rules & Notifications.
- Explore & Report – View daily data on the Dashboard. For long-term trends, use the Reporting page to analyse graphs, stats, and generate PDF reports.
- Invite a User – Need to give team members access? Invite them as a new User on Settings/Users page.
- Access via a mobile device - want access to SiteHive Enviro anywhere/anytime? install the web app on your phone, it takes less than a minute to do.
Dashboard
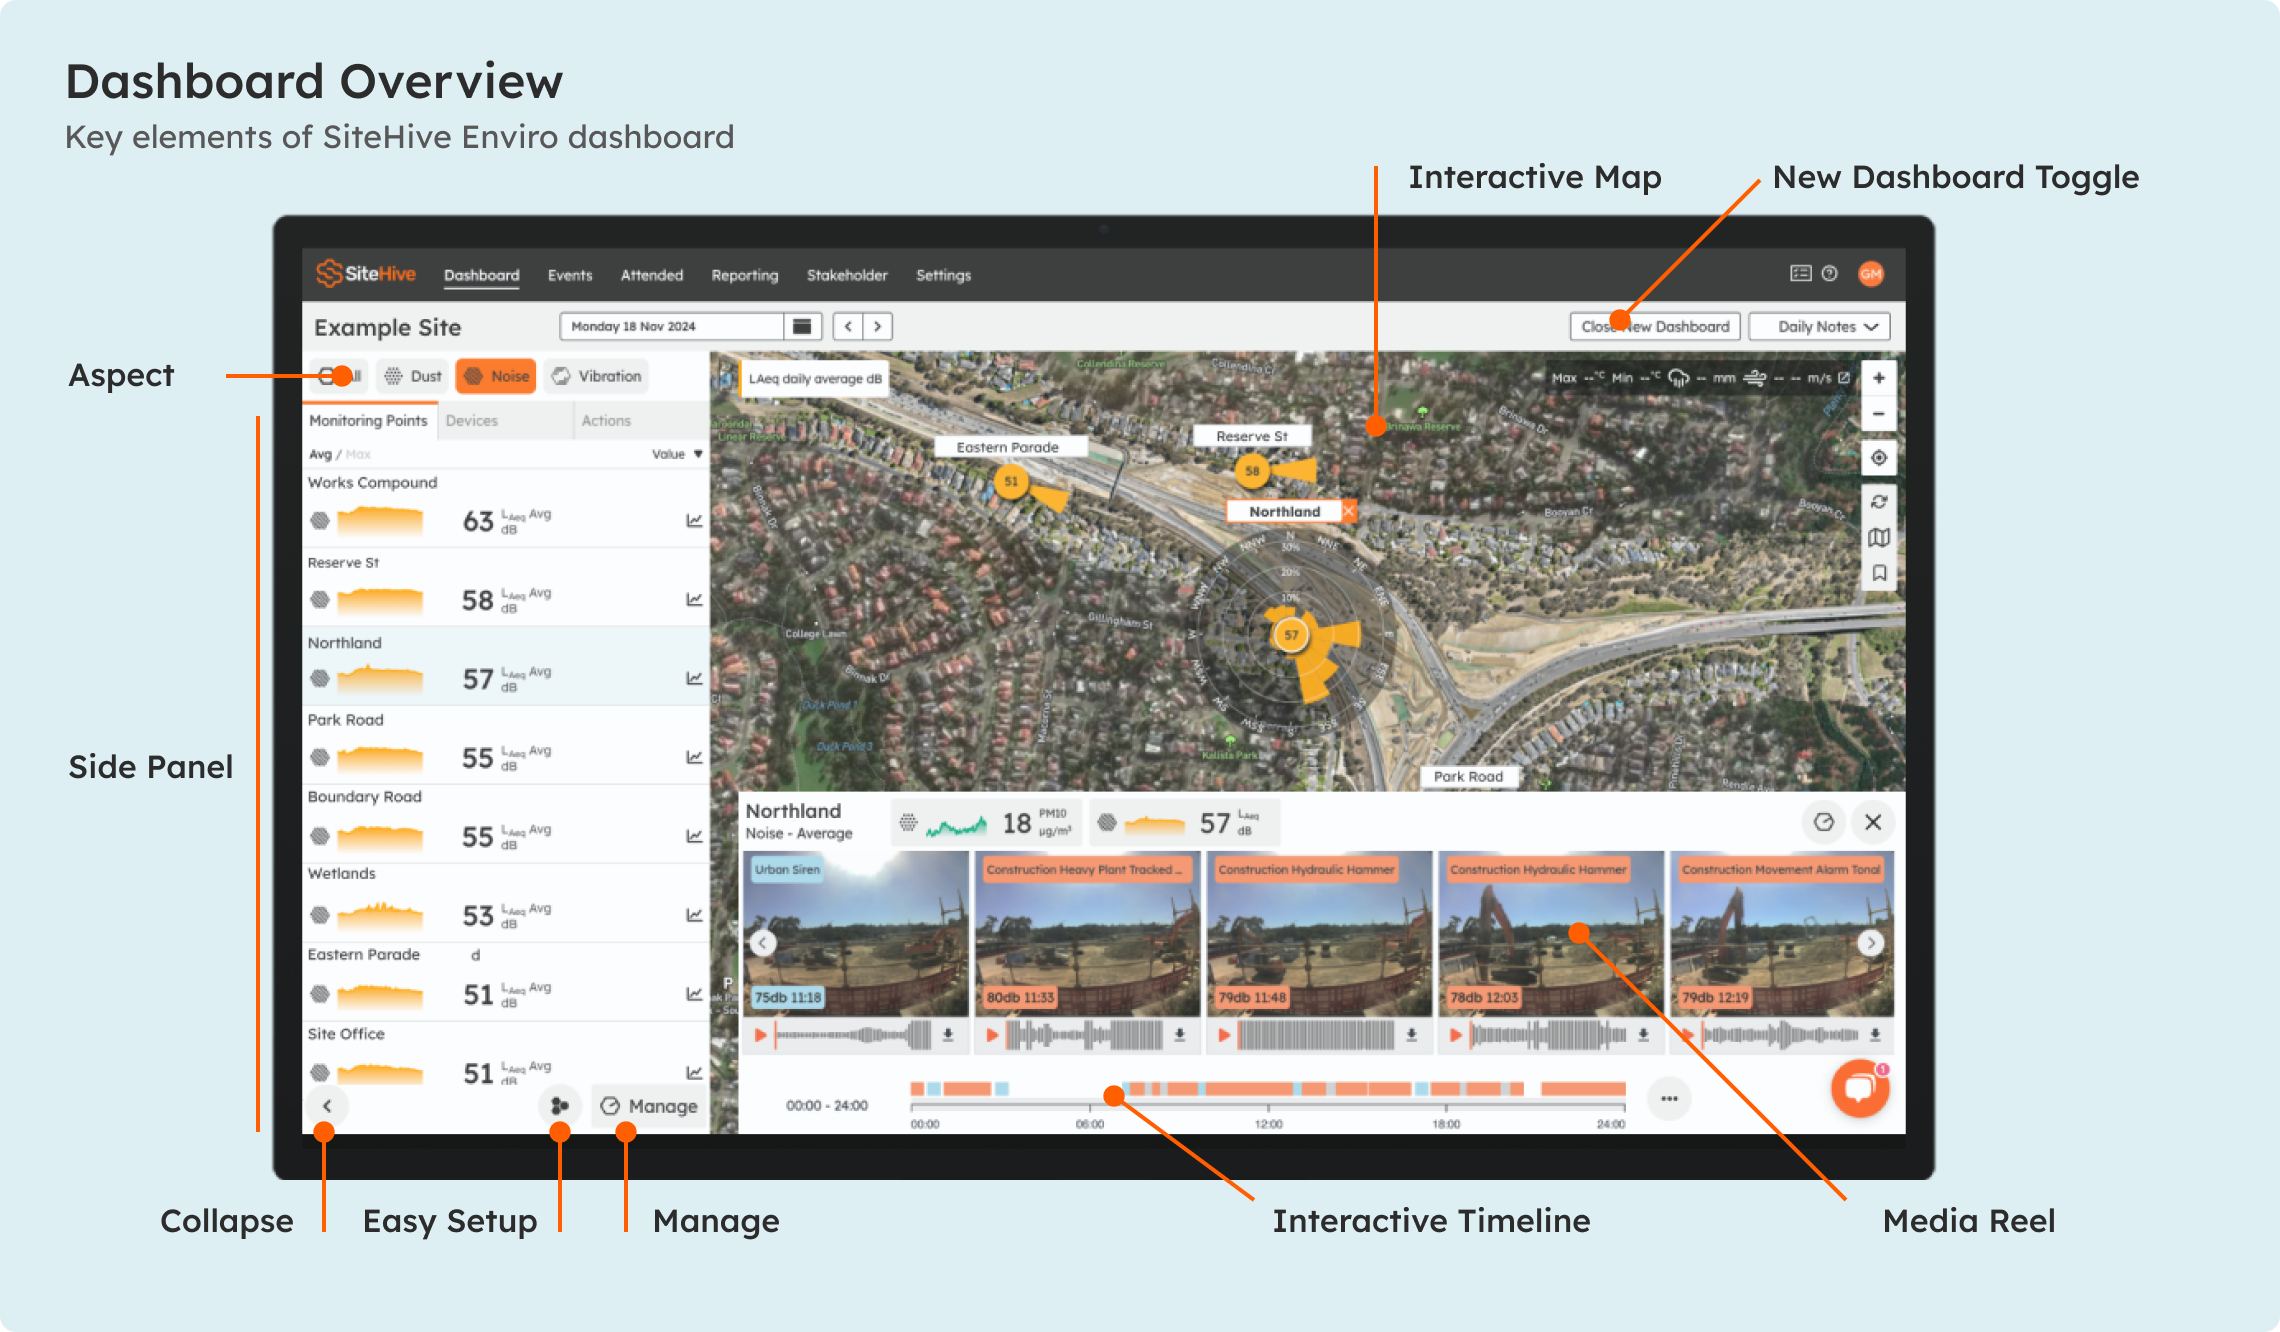
The dashboard presents all the information you need for the daily monitoring of your site. For a complete overview of Dashboard features explore the Dashboard Overview.
- Easily explore todays data, and previous dates
- Site map & data live on map
- Graphs and data
- Media timeline & timeline fitlering
- Daily Notes
Reporting
The Reporting page lets you investigate & reporting data from your site. For a complete overview of Reporting visit Report Overview
- Graphs
- Stats and Analysis
- PDF Reports
- CSV Download
Settings
Go to settings for manage these aspects of your site.
- Site Details
- Devices & Monitoring Points
- Rules & Notifications
- Users