
Weather data with SiteHive
Understanding local weather conditions is a critical element in planning works and investigating environmental events on site. SiteHive makes this a lot easier by automatically including weather from a range of sources.
- Dashboard
- Reporting
- Weather affected periods
- OpenWeatherMap
- How to add your own on site weather station to SiteHive Enviro Pro
Dashboard
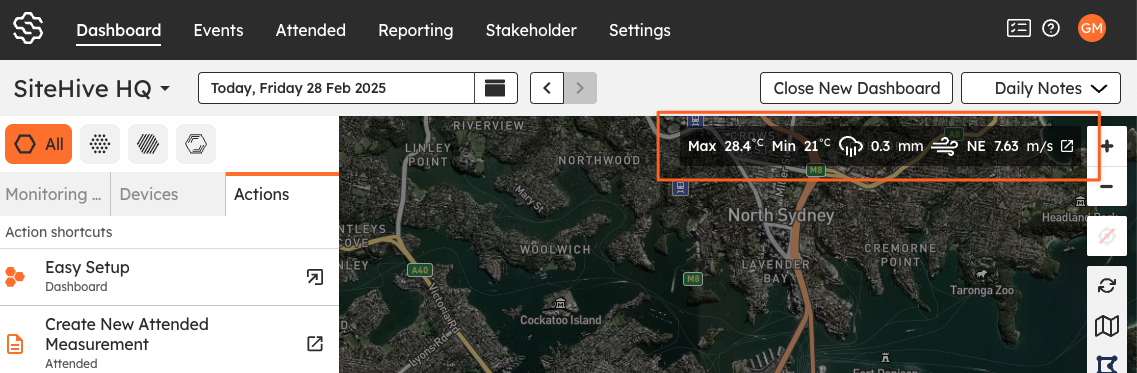
The SiteHive dashboard includes a daily forecast, directly on your site map on the dashboard.
Actual recorded weather is shown as it becomes available, from either the nearest 3 Bureau of Meteorology station (for sites in Australia) or your own onsite weather station. The forecast for the remainder of the day is provided by OpenWeatherMap.
There are key weather parameters provided:
- Maximum and minimum temperature
- Total rainfall (mm)
- Maximum windspeed (km/hr)
- Dominant wind direction
Reporting
In reporting, weather is graphed in the graphs section, so data can be correlated with measurements from your own on site environmental monitoring:
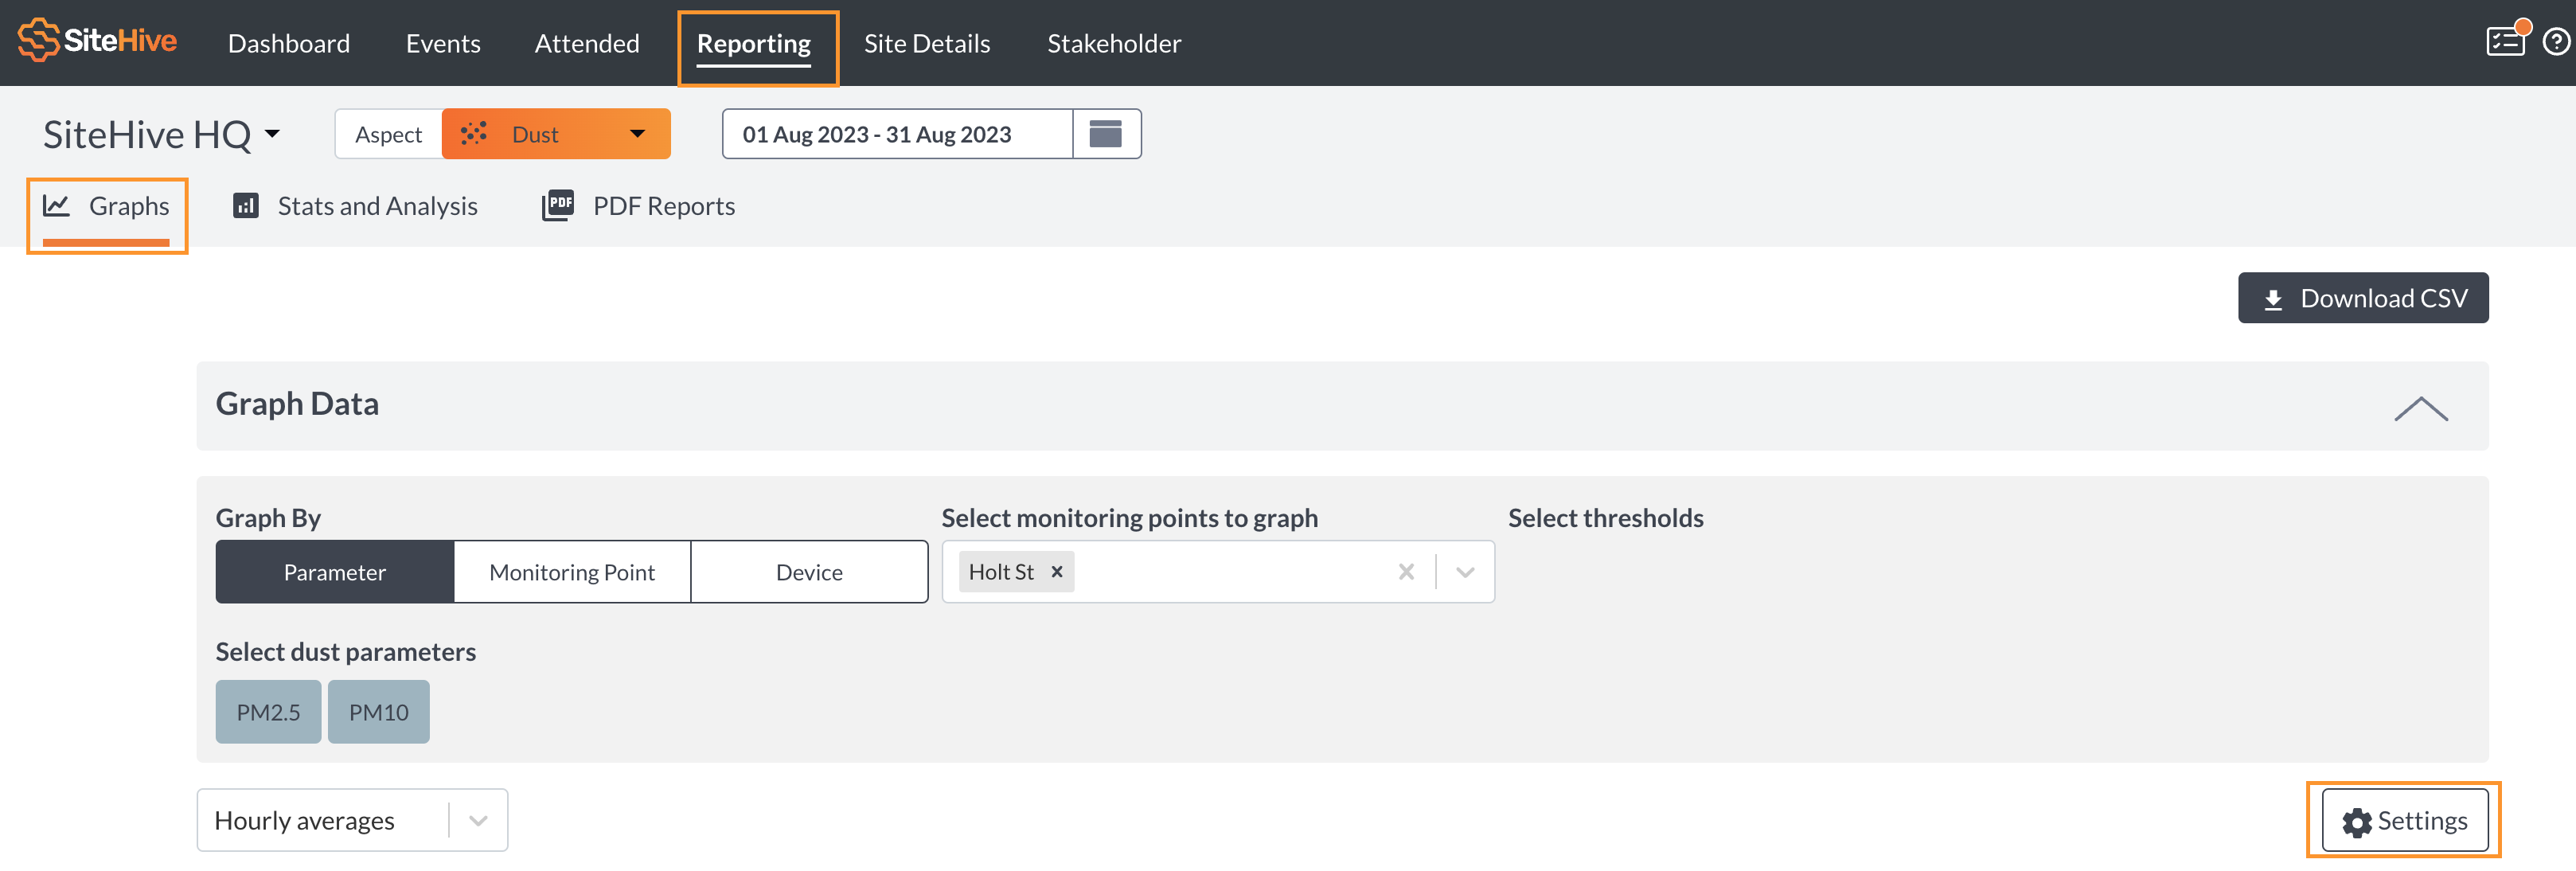
- Look to your top menu bar and click 'Reporting' and go to 'Graphs'
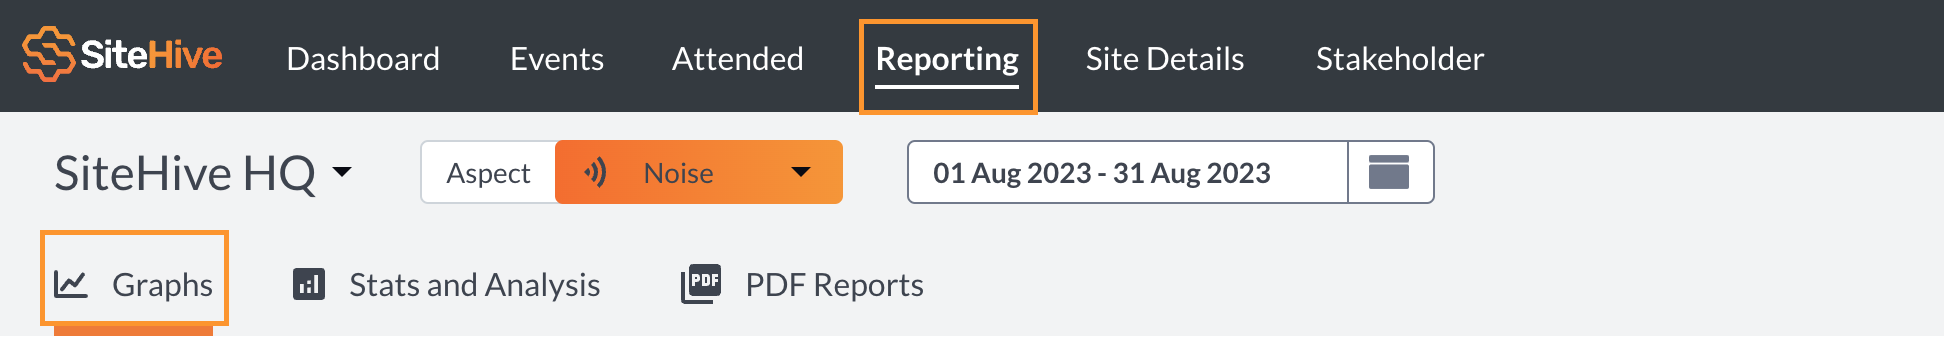
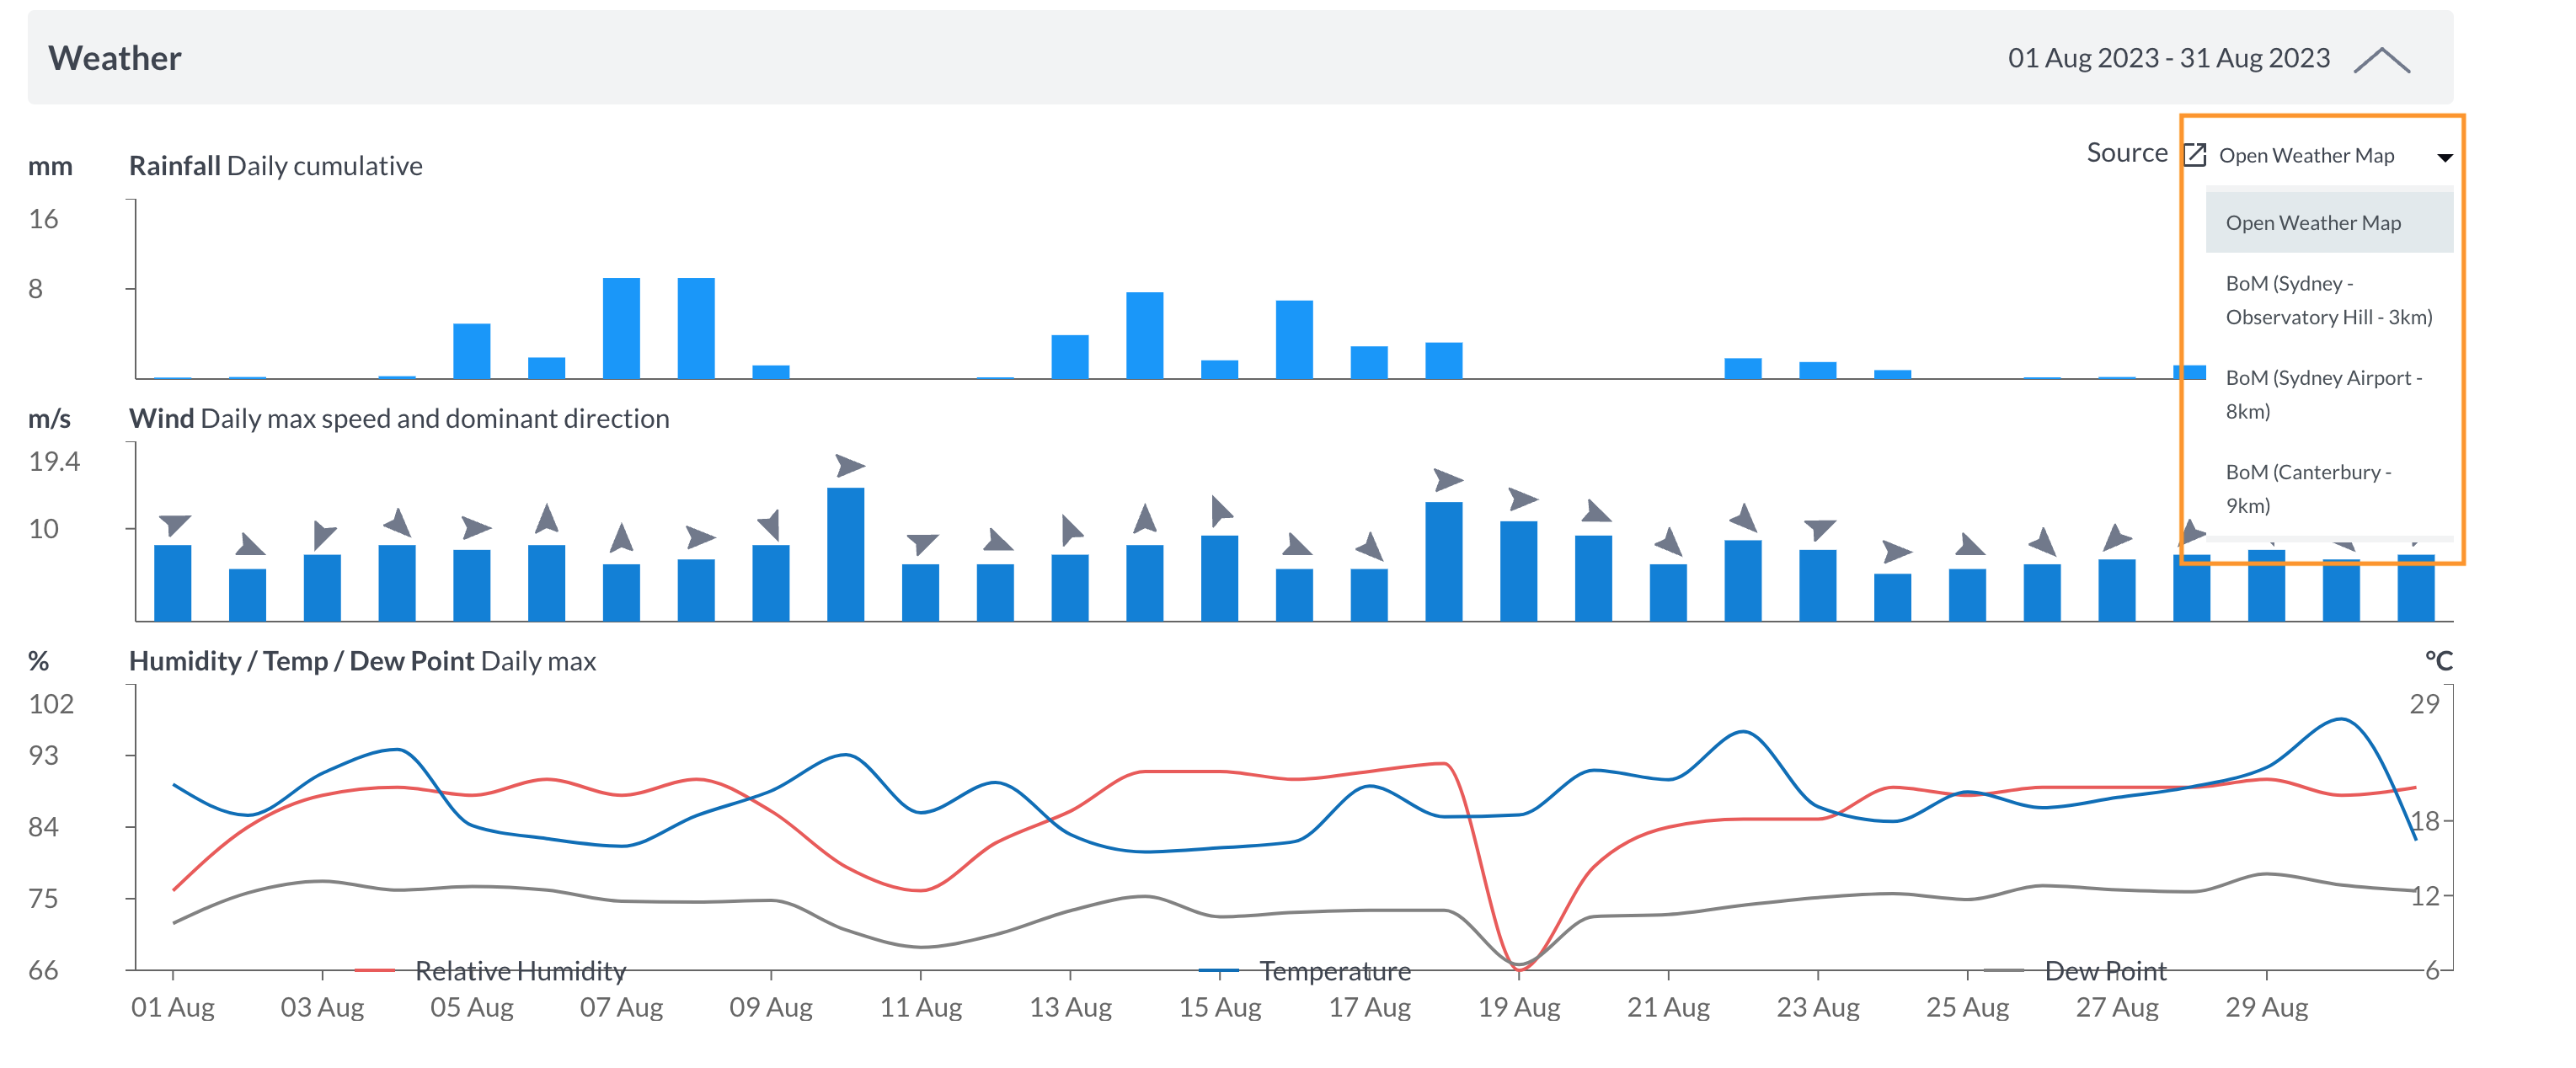
- Scroll down to 'Weather' where you will find Rainfall (daily cumulative), Wind (daily max speed and dominant direction and Humidity/Temp/Dew point (daily max).
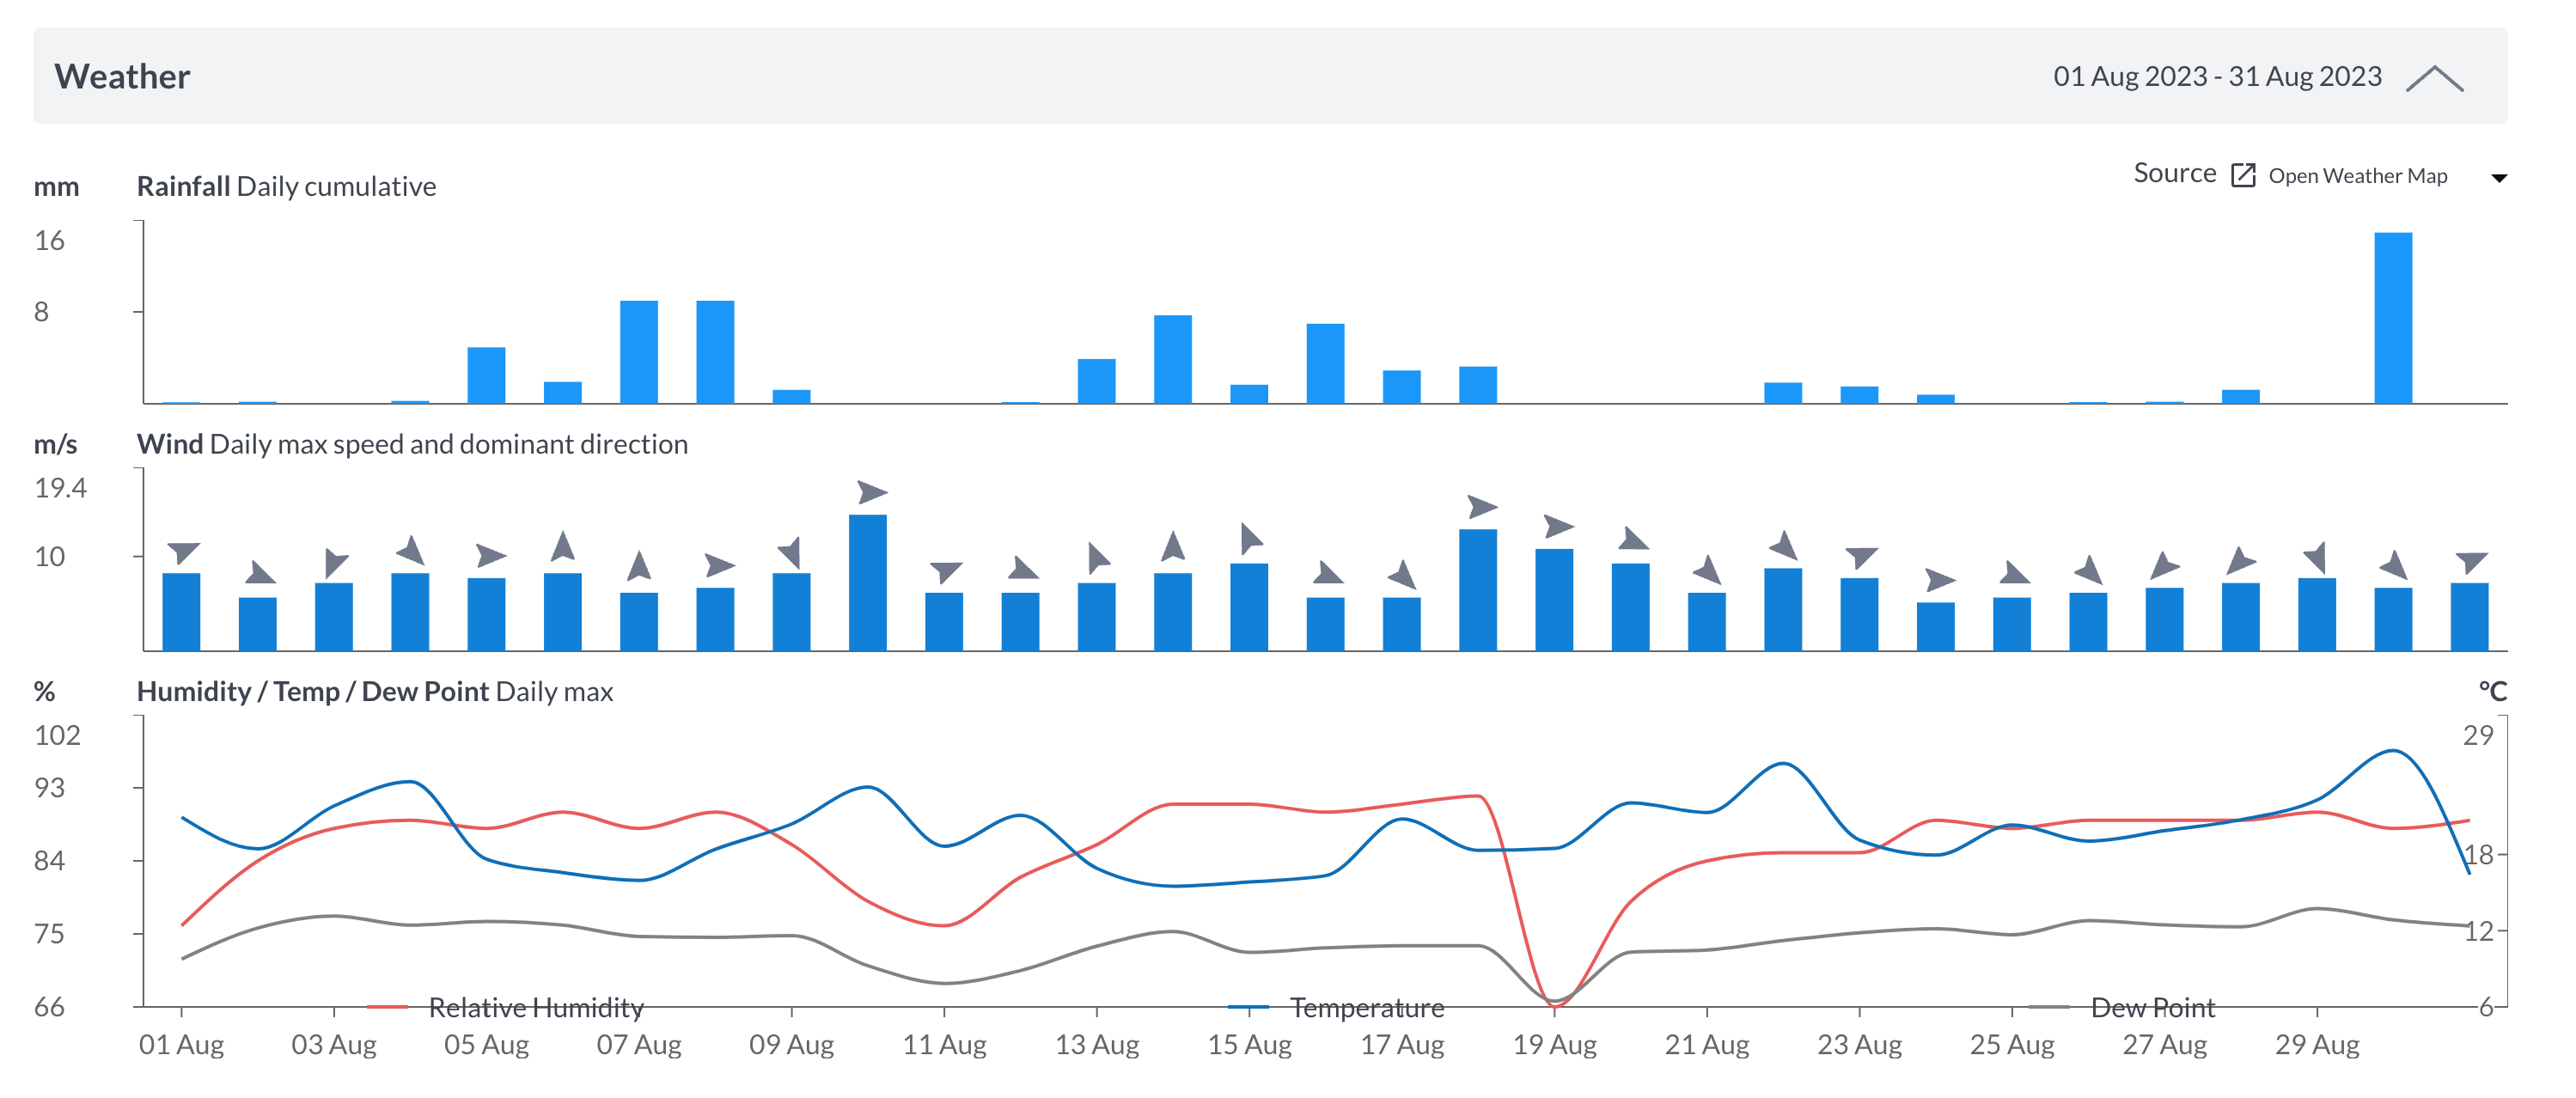
- You can hover your mouse over the graphs to get a granular breakdown:
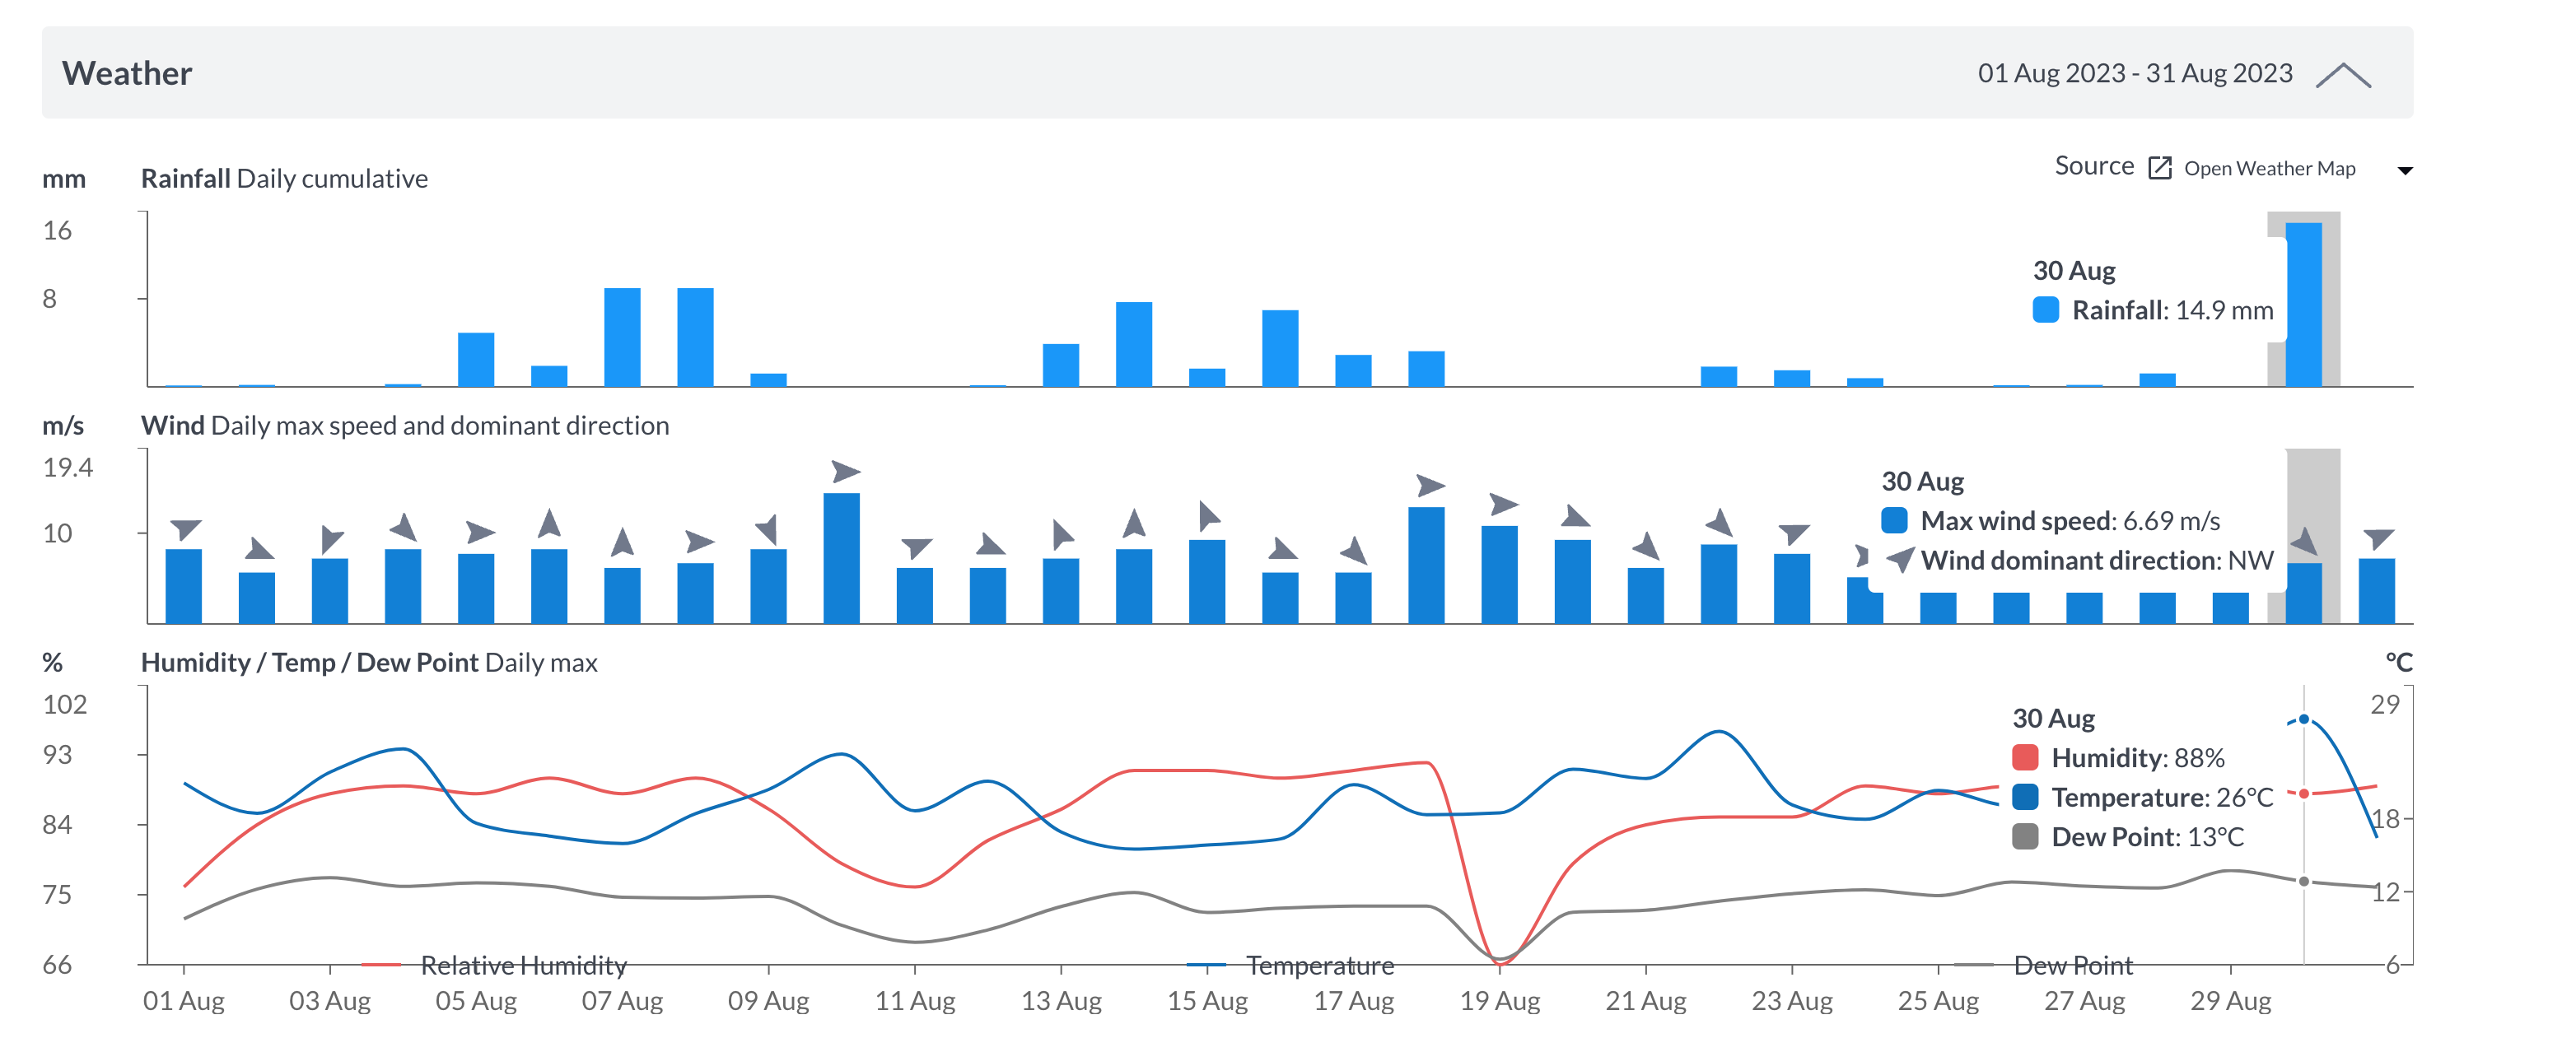
The weather graphs are default set to OpenWeatherMap - however, we also provide you with the 3 closest BoM stations near your site:
Weather affected periods
Meteorological conditions on site can affect measurements made by even the most precise environmental monitoring devices. So it’s important to know the weather conditions on site and be able to identify any measurements that may have been impacted by them.
Teams need to identify genuine spikes in environmental aspects (noise, dust, etc), vs spikes caused by wind, rain, or even humidity.
- Meteorological conditions can influence environmental monitoring device measurements on construction sites.
- Weather-affected data can be distinguished from genuine spikes in noise, dust, etc.
- Site teams can set specific criteria to determine weather-affected periods.
- Different weather elements impact environmental aspects differently (e.g., rainfall and windspeed affect noise, while rainfall and humidity affect dust).
To make it easy to identify weather-affected data, SiteHive automatically highlights potentially weather-affected periods and allows users to customise weather parameters and thresholds in the 'settings' section above the dashboard and reporting graphs:
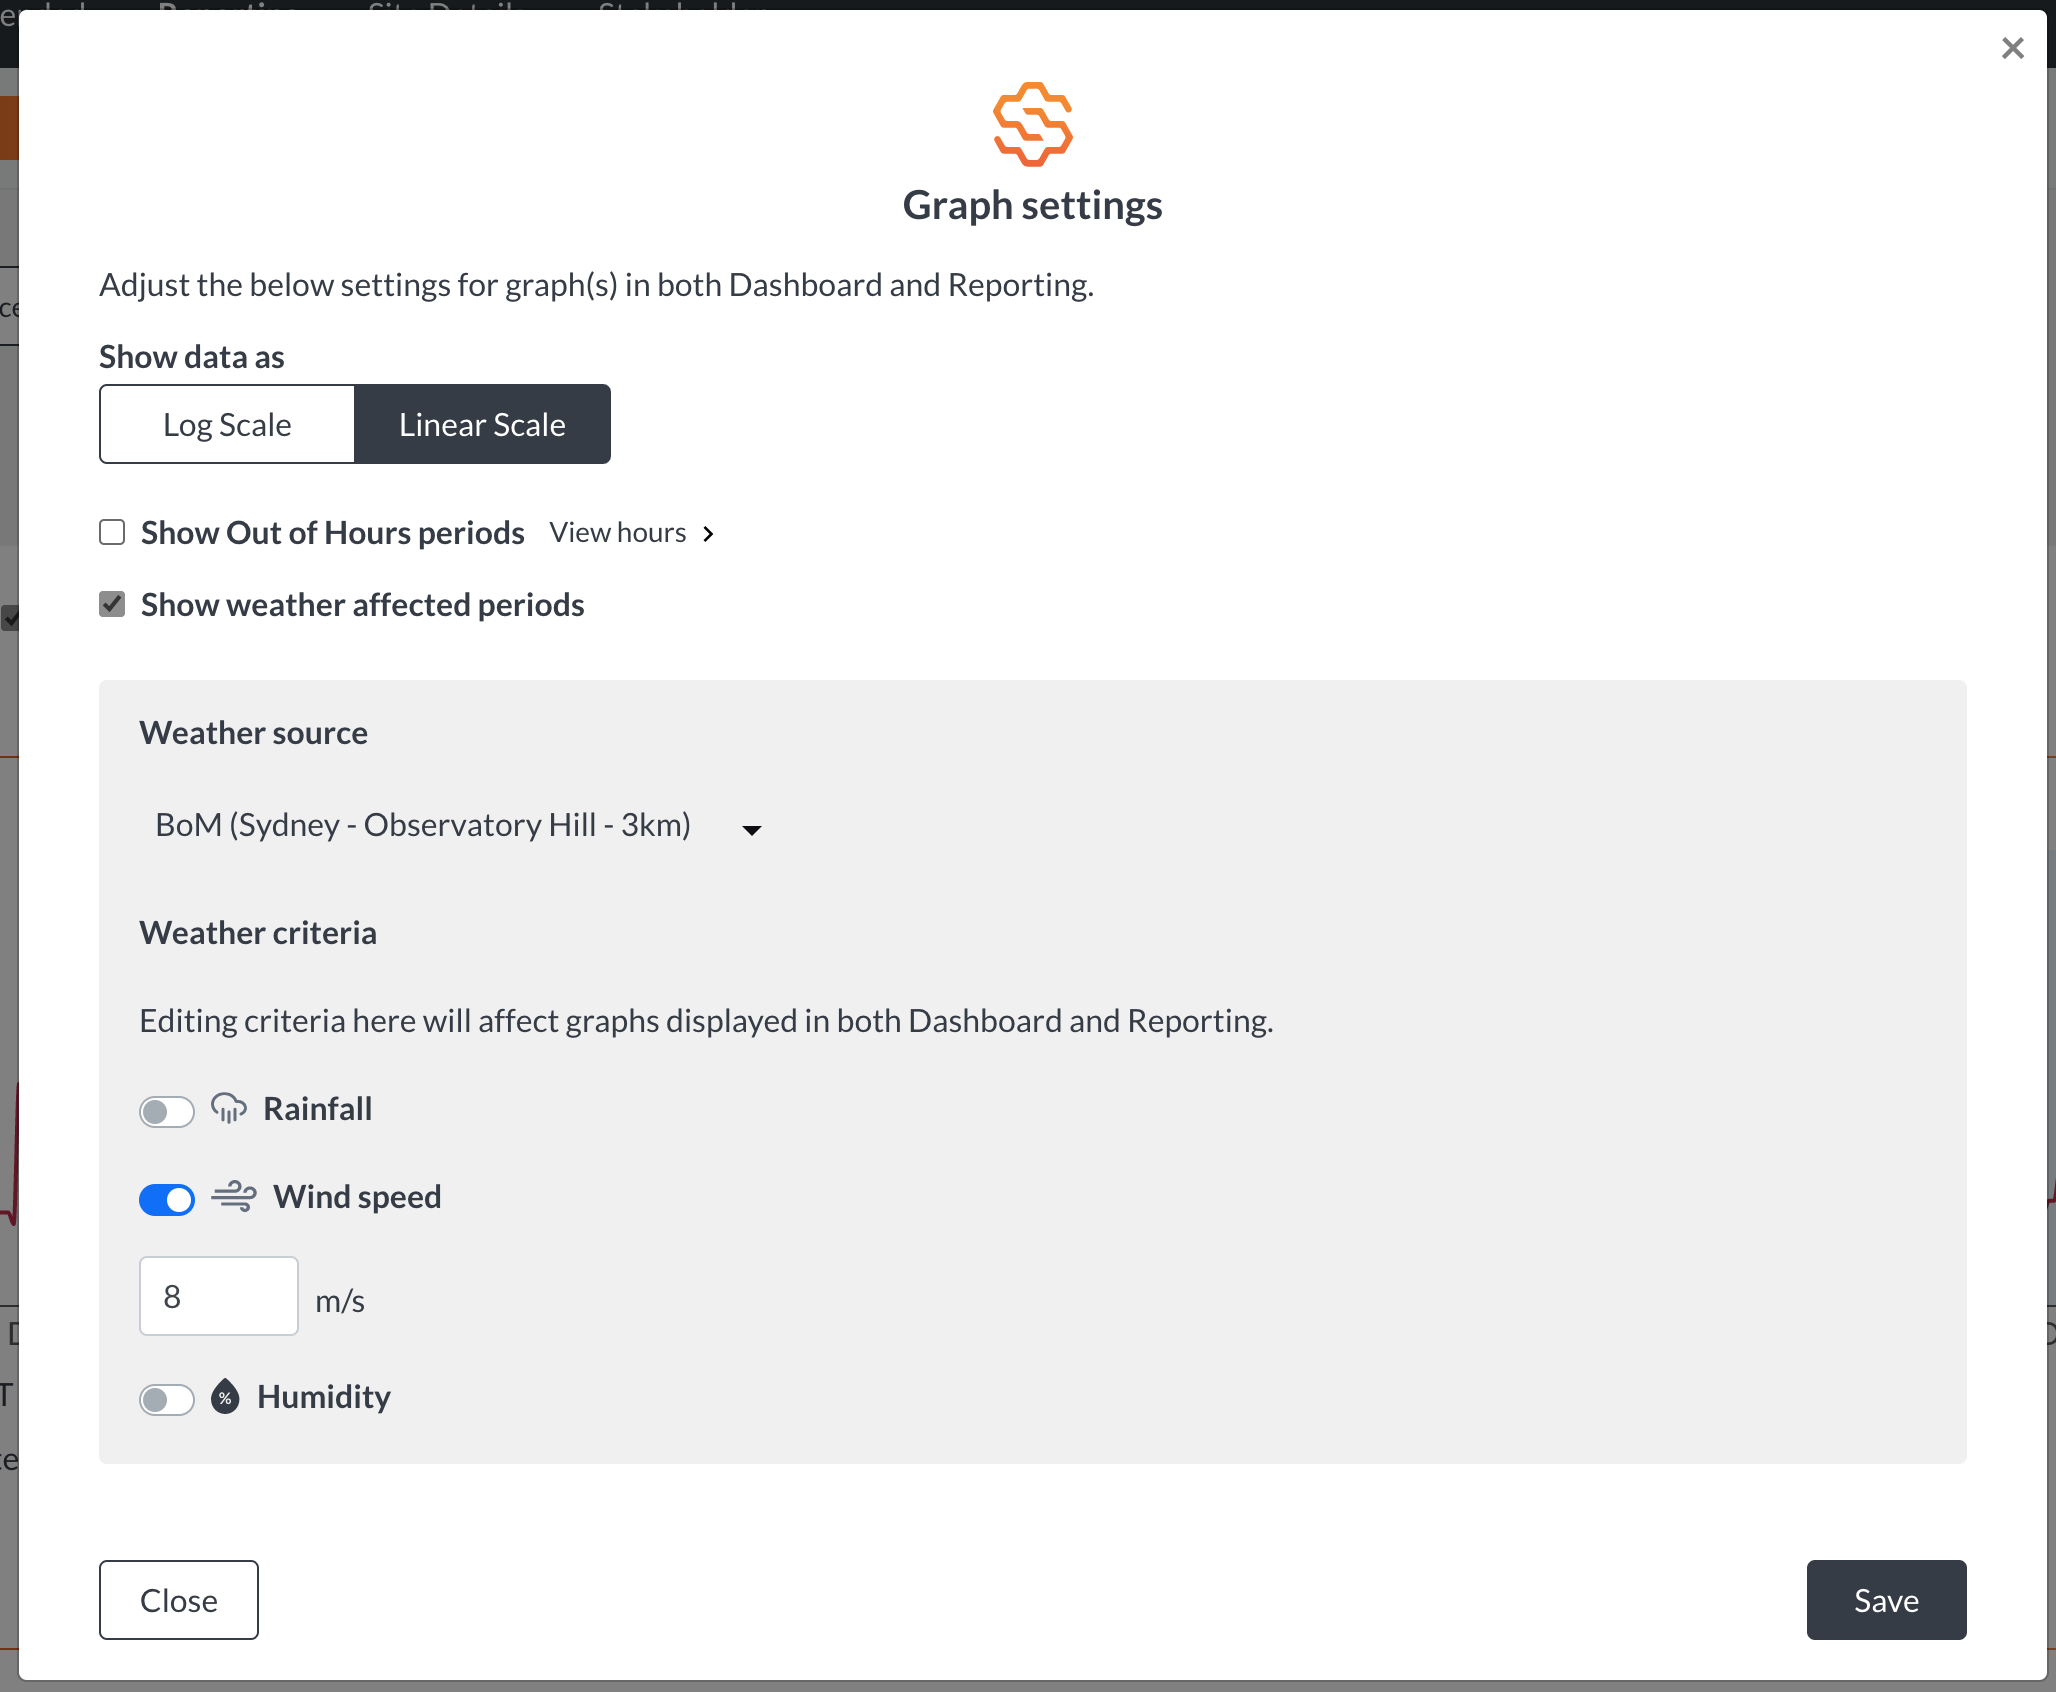
ℹ️ Weather-affected periods are also automatically removed as part of Noise Background Level Calculations so that they don’t impact your reporting.
OpenWeatherMap
Unlike measurements from a singular weather station, OpenWeatherMap takes data from numerous sources to create a prediction of the weather at your site location. It is unlikely to be as accurate as an actual measurement but does provide weather data for any location.
OpenWeather Numerical Weather Prediction uses machine learning technology to predict at 90% to 100% accuracy at a 500m precision (i.e. based on a 500m grid). To make these predictions, data is collected and processed from numerous sources including 82,000 weather stations spread globally, national meteorological agencies, radars and weather satellites.
ℹ️ To make sure that the OpenWeatherMap data is relevant to your site, ensure that your site location is set correctly in Site Details.

Add your own on site weather station to SiteHive Enviro Pro
In addition to the weather data we provide you with, you can add your own on site weather station to SiteHive Enviro Pro, contact us to set this up. Supported devices include:
Information we will need to set up your HOBO device on SiteHive Enviro Pro:
ℹ️ To connect your HOBO device to your SiteHive Enviro Pro dashboard you will need to request your API Key from Hobolink support.
Once you have your API Key we will need your user ID and device serial number.
- User ID
- Device serial number
Information we will need to set up your Davis device on SiteHive Enviro Pro:
ℹ️ To be able to set up your Davis device on your SiteHive Enviro Pro dashboard you will need to have a Davis Vantage Pro account.
- Station Name
To find your station name go to 'Device info' and find the 'Station Name.'
- API Key v2 and API Secret:
To find your API Key v2 go to 'Account Information' and scroll down to 'API Key v2.'
When you have got the above information - please contact support@sitehive.co and we can easily integrate your weather station for you.