
Manage dust with SiteHive
By monitoring dust levels, we can proactively identify any increases, determine their underlying causes, and take necessary action to prevent or mitigate their impact on stakeholders.
🔎 Quick Search
- Mastering dust monitoring with SiteHive: Key capabilities and functions
- The purpose of dust monitoring
- Real-time dust monitoring
- Types of measurement: Reference monitoring
- Types of measurement: Construction monitoring
- Types of measurement: Lab-based analysis
- Types of measurement: Real-time monitoring
- How to: Calibrate dust with a K-factor
- Dust Spikes
- Calculating Direction of Arrival (DoA)
- Useful links
- Relevant policy
- Glossary of terms
Mastering dust monitoring with SiteHive: Key capabilities and functions
- Measure PM2.5 and PM10 in real-time, 24/7, from wherever you are
- Calculate direction of arrival of dust based on meteorological conditions
- Lower-cost devices mean you can monitor at more locations
- Use SiteHive Hexanode images and audio files to determine potential causes
- Nearby (or on site) weather data from BoM automatically available for reference
- Compare local dust conditions with nearby reference EPA monitoring stations to determine local vs reference levels
- Automate monthly reporting, including graphs of trends and summary statistics (e.g. daily averages)
The purpose of dust monitoring
Managing construction dust is primarily about mitigating the impact of works on stakeholders.
The main focus of dust monitoring is to identify:
- Any dust level increases
- Understand their cause
- Take action to prevent or mitigate them
👀 Visual observations and record keeping are usually the primary method of managing dust, supported by dust monitoring.
Many Construction Environmental Management Plans (CEMPs) have dust compliance rules in the form of time-based limits for PM2.5 and PM10 levels, typically covering days, weeks, months and/or years.
The table below shows an example from Western Sydney Airport Bulk Earthworks (see references to NSW EPA & NEPM-AAQ below under Relevant Policy):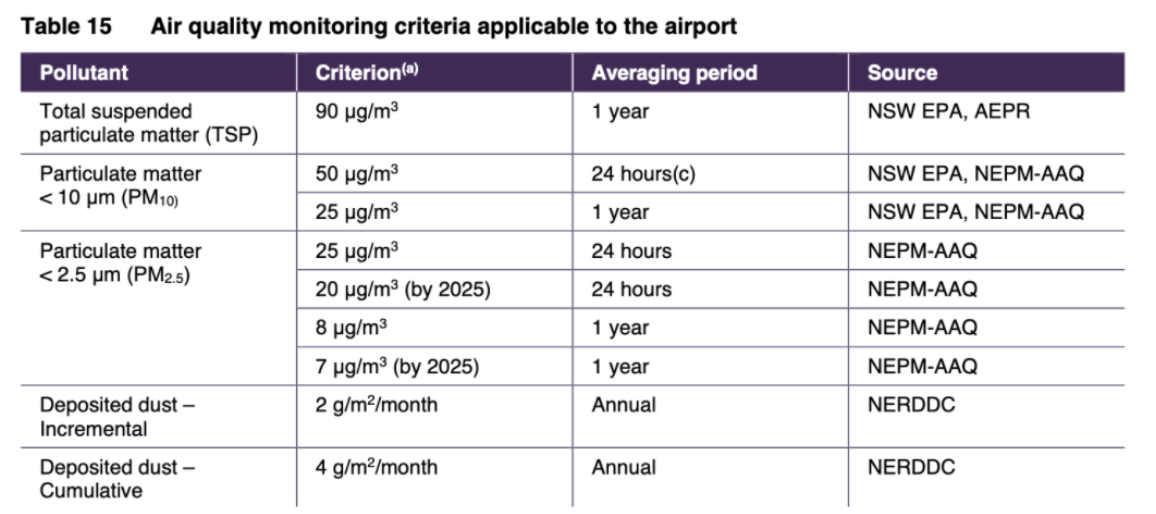
Compliance-based measurements are typically required to be undertaken using dust deposition gauges (DDGs), whereby samples taken over a period of time (usually a month) are sent to a lab to determine volume and type of dust over the previous period.
The obvious downside of this approach is that any issues will only be identified weeks after they occurred, which doesn't enable proactive management to prevent issues from occurring.
It is much more useful to know whether a site might exceed the dust limit in real-time, as this allows action to be taken to prevent potential issues from occurring.
New technologies, such as optical particle counters (as used by SiteHive Hexanodes), make this possible and allow daily values to be calculated as often as required.
Real-time dust monitoring
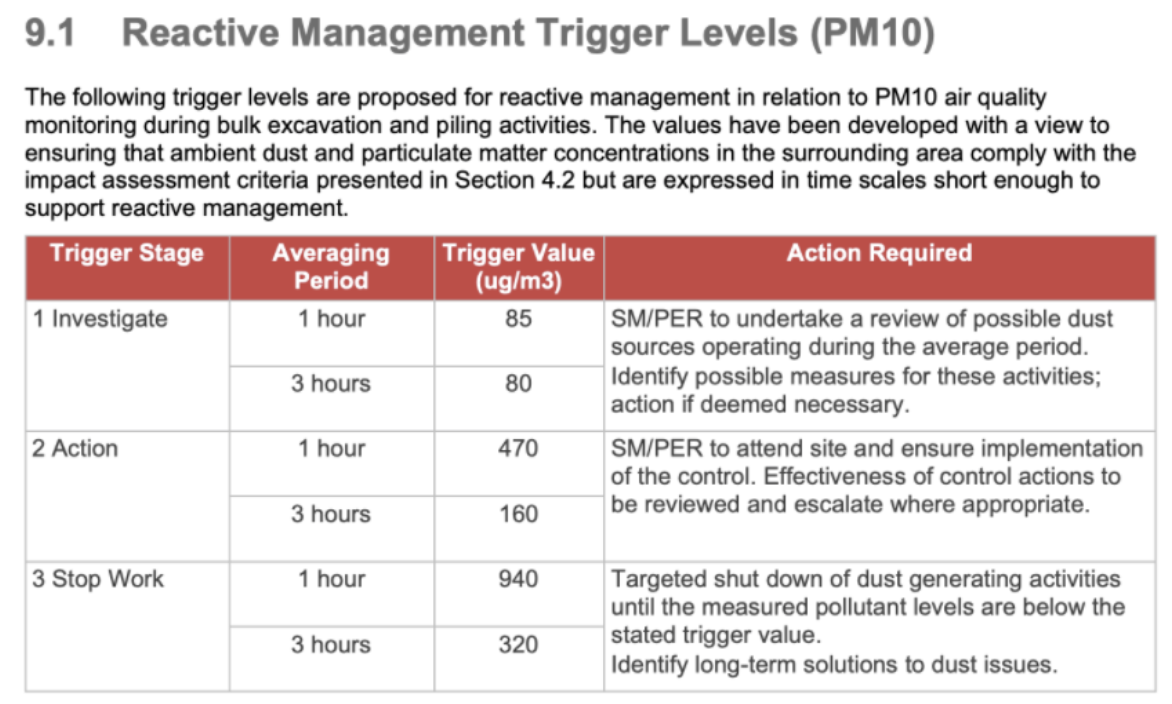
Real-time monitoring using this new technology allows management rules to be used throughout the day (e.g. rolling averages) to identify trends in the levels and enable remedial action before a dust event occurs.
The below shows an example of management rules from the Sydney Football Stadium redevelopment, and the full plan is linked here: Sydney Football Stadium:
Types of measurement
Reference monitoring
There are several ways to express the amount of particles in the air. Most State-based Governments (e.g. NSW EPA, QLD EPA) run air quality monitoring stations, using approved sampling methods: https://www.epa.nsw.gov.au/your-environment/air/industrial-emissions/sampling-analysing-air-emissions/approved-methods-sampling-analysing-air-pollutants, to provide a network of air quality data.
The methods used at these sites are:
- TEOM (Tapered element oscillating microbalance)
- BAM (Beta attenuation monitoring)
- High/Low volume air samplers
All of these have filters that need maintaining/changing. These methods are also very expensive and usually require permanent facilities. For these reasons, they are not typically used for construction monitoring.
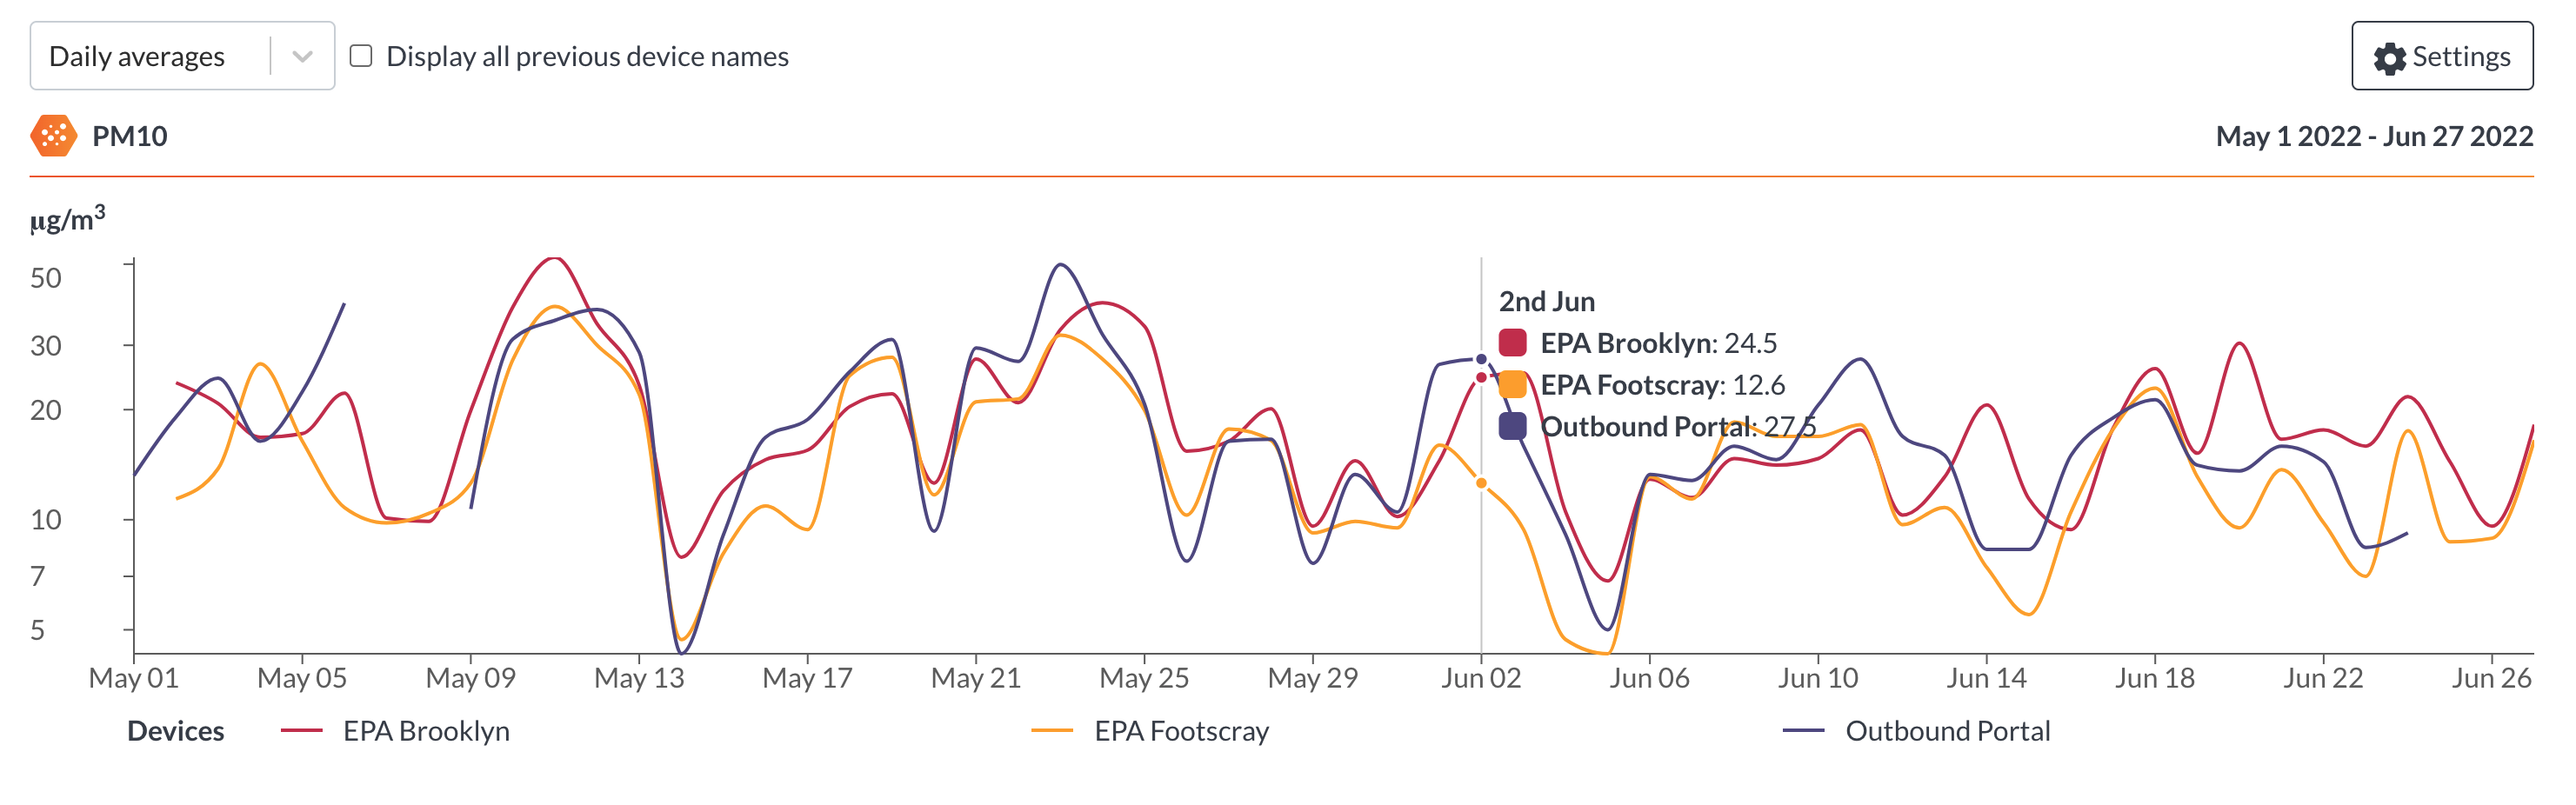
However, construction projects can access and use the data. SiteHive makes it really easy to access this data by adding the nearest government reference station to each project site automatically, so the ambient reference measurements can be compared directly with onsite measurements.
The below shows an example from SiteHive Reporting, showing on site dust monitoring and nearby EPA reference monitoring on the same graphs:
Construction monitoring
A reference grade station is a highly accurate and precise monitoring system used to measure various environmental parameters, such as air quality.
As reference grade stations are too large and expensive, the methods usually used for construction monitoring are outlined below.
Lab-based analysis
Dust Deposit Gauges (DDG)
Dust settles in a container over a defined period (usually 14 or 30 days) and is sent to a lab for analysis that usually provides reporting on volume, mass, and type of dust deposited.
Gravimetric
The most commonly referred to method of dust sampling in the Australian and US standards is gravimetric sampling. This is a filter-based method, and gravimetric dust monitoring involves sampling a known volume of ambient air through a filter. The filters are sent to a lab to be weighed before and after exposure to determine the mass of particles. The collected dust sample is expressed as mass (mg) of dust per cubic meter (m3) of air.
Real-time monitoring
Real-time monitoring differs from the other types of measurement as it enables continuous and proactive monitoring of dust levels. It uses a variety of techniques (outlined below) that each have different price points and accuracy. The US EPA has run a number of field tests with emerging sensors, showcasing their performance against reference grade monitors: US EPA Evaluation of Emerging Air Sensor Performance. The following types of sensors are most often used for real-time construction monitoring.
Light-based sensors
There are three types of light sensors generally used:
- Beta Attenuation Monitor (BAM) - will output a mass concentration
- a photometer - measures the “transparency” of the air;
- an optical particle counter - provides a particle count (the actual number of particles in the air)
Note that photometers and particle counters may also output mass concentrations, but in these devices they are calculated based on the device readings, not the actual raw readings. Also more expensive devices often have features such as a heated inlet, which adds cost and consumes more power, but can reduce erroneous data caused by periods of high humidity.
Commercial real-time monitoring devices may include a combination of different light sensors.
The relative costs of the different types of light sensors are identified by the $ ratings shown below:
- $$$ Beta Attenuation Monitoring (BAM) is a widely-used air monitoring technique that uses the absorption of beta radiation by solid particles extracted from air flow. The main principle is based on a Bouguer (Lambert–Beer) law: the amount by which the flow of beta radiation (electrons) is attenuated by a solid is exponentially dependent on its mass, and not on any other feature (such as density, chemical composition or some optical or electrical properties) of the matter.
- $$ Photometers (e.g., DustTrak, which also collects a gravimetric sample) measure light reflected at a specific angle, and nephelometers (e.g., pDR) measure light reflected over as wide a range of angles as possible. The DustTrak DRX is a combined photometer and optical counter, where a laser diode illuminates a sample stream and reflected light is directed onto a photodetector by a mirror. When properly calibrated the DustTrak DRX has <10% error in comparison to TEOM measurements (Wang et al., 2009).
- $ Optical particle counters (e.g. Sensirion SPS30, Alphasense), measure the light scattered by individual particles carried in a sample air stream through a laser beam. These measurements are used to determine the particle size (which is related to the intensity of light scattered via a calibration based on Mie scattering theory) and particle number concentration. Particle mass loadings (PM1, PM2.5 and PM10) are then calculated from the particle size spectra and concentration data, assuming a particle density and refractive index (RI). The default settings (weighting index 2) for these parameters are typically: density = 1.65 g/ml and RI = 1.5+i0
How to: Calibrate dust with a K-factor
For construction monitoring, optical laser-based dust measurements offer a range of benefits when compared to reference grade instruments. In particular, their lower costs mean that more localised monitoring can take place by deploying more devices.
Undertaking a field calibration can in some instances increase the usefulness of optical sensors by allowing the values to be adjusted based on local conditions. For example, when the type of dust being measured varies across projects undertaking road works, tunneling or cutting concrete. This process is often referred to as a K-factor calibration.
Calibrating dust with K-Factor
The process for developing a K-Factor typically involves:
- co-locating your SiteHive Hexanode with a nearby reference grade monitor
- either BAM [Beta Attenuation Monitor]
- TEOM [tapered element oscillating microbalances]
- gravimetric-based
- deploying a near-reference device, such as a low-volume air sampler on site at the actual deployment location.
Example of calibration
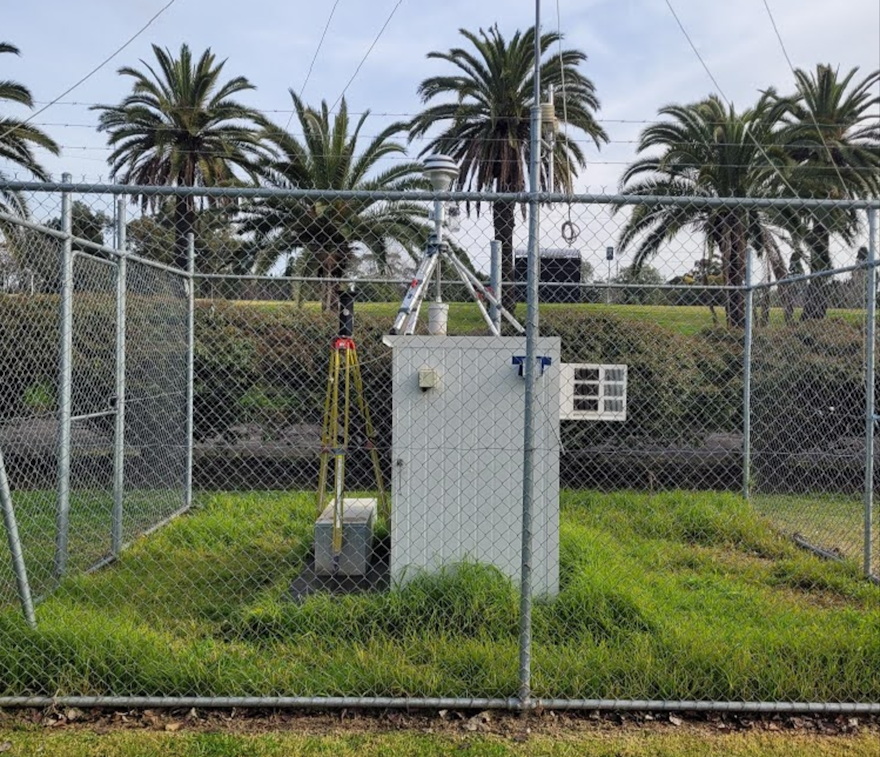
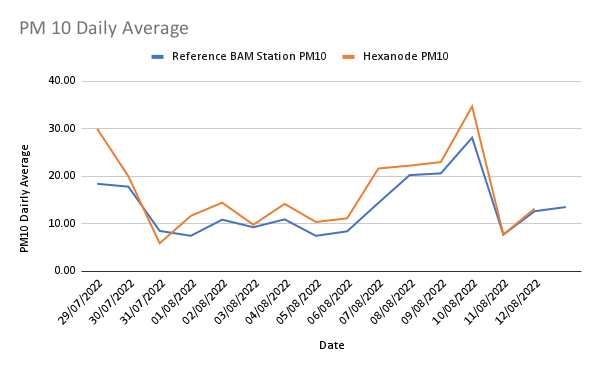
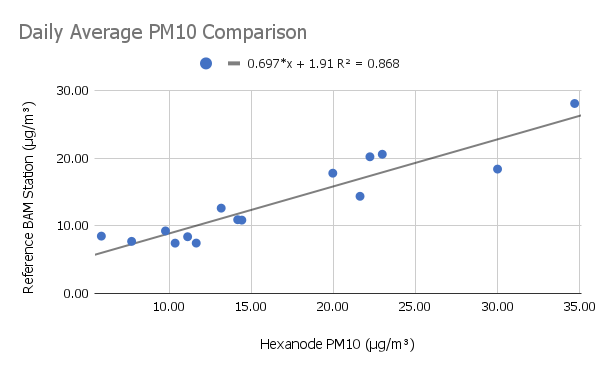
Recently, for a major tunnel project in Victoria, a SiteHive Hexanode was co-located with a BAM monitoring station to undertake this calibration (see image below). Over a 2 week period the results were compared, and a K-Factor was developed.
Over the period, the PM10 values correlated well with the reference BAM monitor:
Results
Based on these results a K-Factor specific to the project was developed and applied, with an R2 value of 0.868.
The SiteHive Hexanode is already close to the BAM monitor in terms of accuracy, and with the K-Factor applied, there is very little difference.
Comparisons like this provide confidence that lower cost, optical-based systems - such as the SiteHive Hexanode - can be relied on to provide valuable insight into project performance and impacts. As more of this technology is being used, projects are enabled to undertake proactive environmental management in real time.
Dust spikes
Optical particle counters, such as the sensor used in the SiteHive Hexanode Multi, along with a range of other industry standard devices, have a range of benefits over traditional approaches including being more compact, lower cost, and able to measure in real-time.
However, they also have some limitations, including producing measurements based on some assumptions (specifically particle density [weight] and refractive index [shape]), which can result in some conditions causing significant spikes in data that are not actual measurements of construction dust.
The Victorian EPA has published a useful guide explaining more about this: https://www.epa.vic.gov.au/about-epa/publications/1745
These are commonly seen in a few consistent scenarios:
- Moisture in the air is measured as dust e.g. high relative humidity, low dew point
- Hyperlocal dust/smoke e.g. near a bbq/smoko/air conditioner unit
- Ambient conditions e.g. bushfires
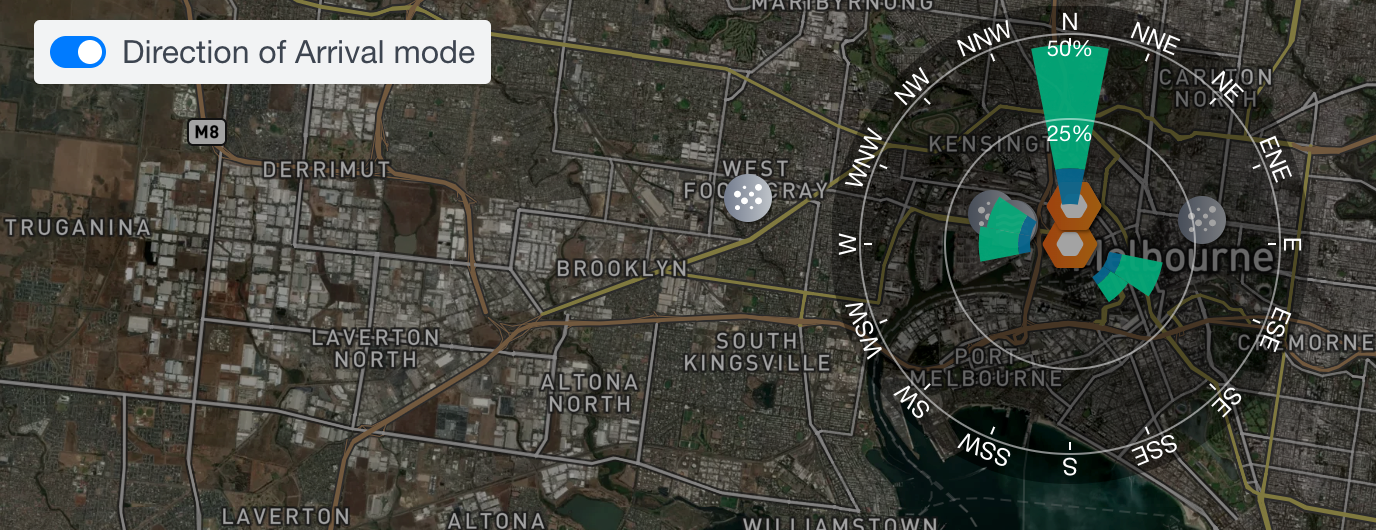
Calculating Direction of Arrival
Understanding the source of dust on your site can be a complex challenge, with local weather conditions often causing dust to be blown on and off site, impacting local stakeholders and communities. To make it easier to understand where dust is coming from, SiteHive shows indicative dust Direction of Arrival (DoA).
Taking inspiration from a traditional pollution rose, the SiteHive dust DoA plot shows the percentage of dust that has come from each direction, for the day so far.
The percentages are calculated based on PM2.5/PM10 readings and the wind direction at the time of the reading. So, for instance, if a PM10 mass of 180 is measured with a corresponding wind direction of North, and 20 is measured with wind blowing South, then 90% of the PM10 will be shown as coming from the North, and 10% from the South.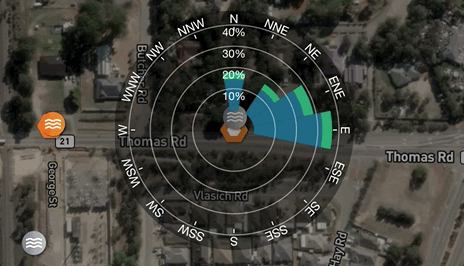
The DoA plot is meant to be indicative, rather than definitive, and is designed to help you understand where dust may be originating. Having an anemometer (a device that measures wind) co-located with the SiteHive Hexanode will give the most accurate input to this plot. The source of the wind data is currently Openweathermap, but we’ll look to broaden this out to include alternative sources soon.
Other useful links
Kaiterra knowledge base, explaining context and methodology for how they measure pm2.5.
South Coast air quality management district
The South Coast Air Quality Management District (South Coast AQMD) is the agency responsible for attaining state and federal clean air standards in the South Coast Air Basin in southern California. With a population of 14.6 million, the South Coast Air Basin covers an area of 6,745 square miles, which includes Los Angeles. In order to inform the public about the actual performance of commercially available ‘low-cost’ air quality sensors, the South Coast AQMD has established the Air Quality Sensor Performance Evaluation Center (AQ-SPEC) program, which characterises sensors under both field and laboratory conditions. AQ-SPEC field evaluations.
Relevant policy
The standards in Australia are very specific to each method, and have not yet kept up with newer technology such as optical particle counters. If your management plan specifies that you need to comply with one of the standards below, then you must use that method. Where no standard is defined, or the management plan is more focused on real-time management, then optical particle counters are a great tool for the job.
The National Environment Protection (Ambient Air Quality) Measure - NEPM aims to achieve National Environment Protection Standards as assessed in accordance with (set) monitoring protocol. The desired outcome of the NEPM is an ambient air quality that allows for the adequate protection of human health and well-being.
Each state also typically has their own approved sampling methods, which overlap with the NEPM. For example the NSW EPA approved methods for the sampling and analysis of air pollutants and the Queensland Government Environment department summary of methods for sampling particulates.
Standards referenced by the NEPM:
Particles as PM10
- Determination of Suspended Particulate Matter-PM10 High Volume Sampler with Size Selective Inlet-Gravimetric Method AS/NZS 3580.9.6:2003
- Determination of Suspended Particulate Matter- Dichotomous sampler (PM10, coarse PM and PM2.5) – Gravimetric method AS/NZS 3580.9.7:2009
- Determination of Suspended Particulate Matter-PM10 continuous direct mass method using tapered element oscillating microbalance analyser. AS/NZS 3580.9.8-2008
- Determination of Suspended Particulate Matter-PM10 Low Volume Sampler-Gravimetric Method AS/NZS 3580.9.9:2006
- Determination of Suspended Particulate Matter-PM10 beta attenuation monitors AS/NZS 3580.9.11:2008/Amdt 1 :2009
Particles as PM2.5
- Determination of Suspended Particulate Matter-PM2.5 low volume sampler-Gravimetric Method AS/NZS 3580.9.10:2008
- Determination of Suspended Particulate Matter-PM2.5 beta attenuation monitors AS/NZS 3580.9.12:2013
- Determination of Suspended Particulate Matter-PM2.5 continuous direct mass method using a tapered element oscillating microbalance monitor AS/NZS 3580.9.13:2013
- Determination of Suspended Particulate Matter-PM2.5 high volume sampler with size-selective inlet – Gravimetric Method AS/NZS 3580.9.14:2013
Glossary of terms
PM2.5 - Airborne particles less than 2.5 micrometers in diameter
PM10 - Airborne particles less than 10 micrometers in diameter
TSP - Airborne particles up to about 100 micrometers in diameter are referred to as TSP (total suspended particles).
TPS - Typical Particle Size, output from some optical laser particle counters
BAM - Beta Attenuation Monitor
TEOM - Tapered Element Oscillating Microbalance