Attended
The SiteHive Enviro Pro Attended serves as a tool for capturing data during in-person field work. It seamlessly integrates with all unattended data, ensuring a comprehensive record of all site data within SiteHive.
Attended Measurements
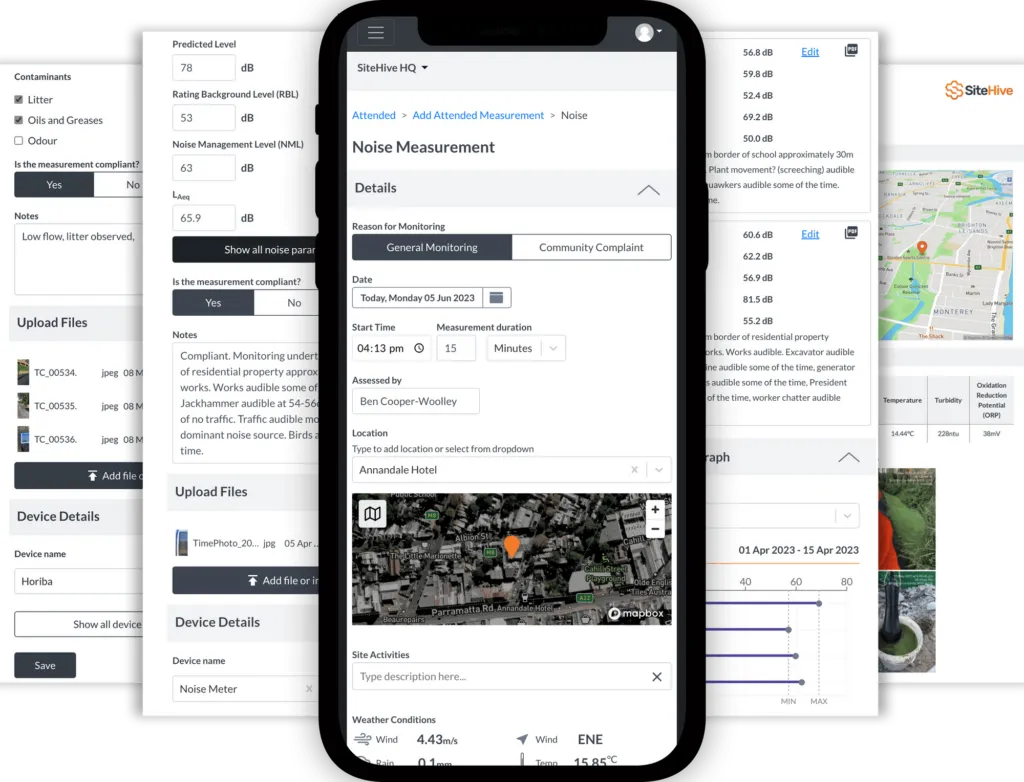
SiteHive Enviro Pro includes the SiteHive Attended App, which allows onsite measurements to be captured, analysed and reported instantly. Record field measurements for water, noise, dust, vibration and odour.
Add contextual images and weather data. Report on trends over time and between locations.
How to add attended measurement
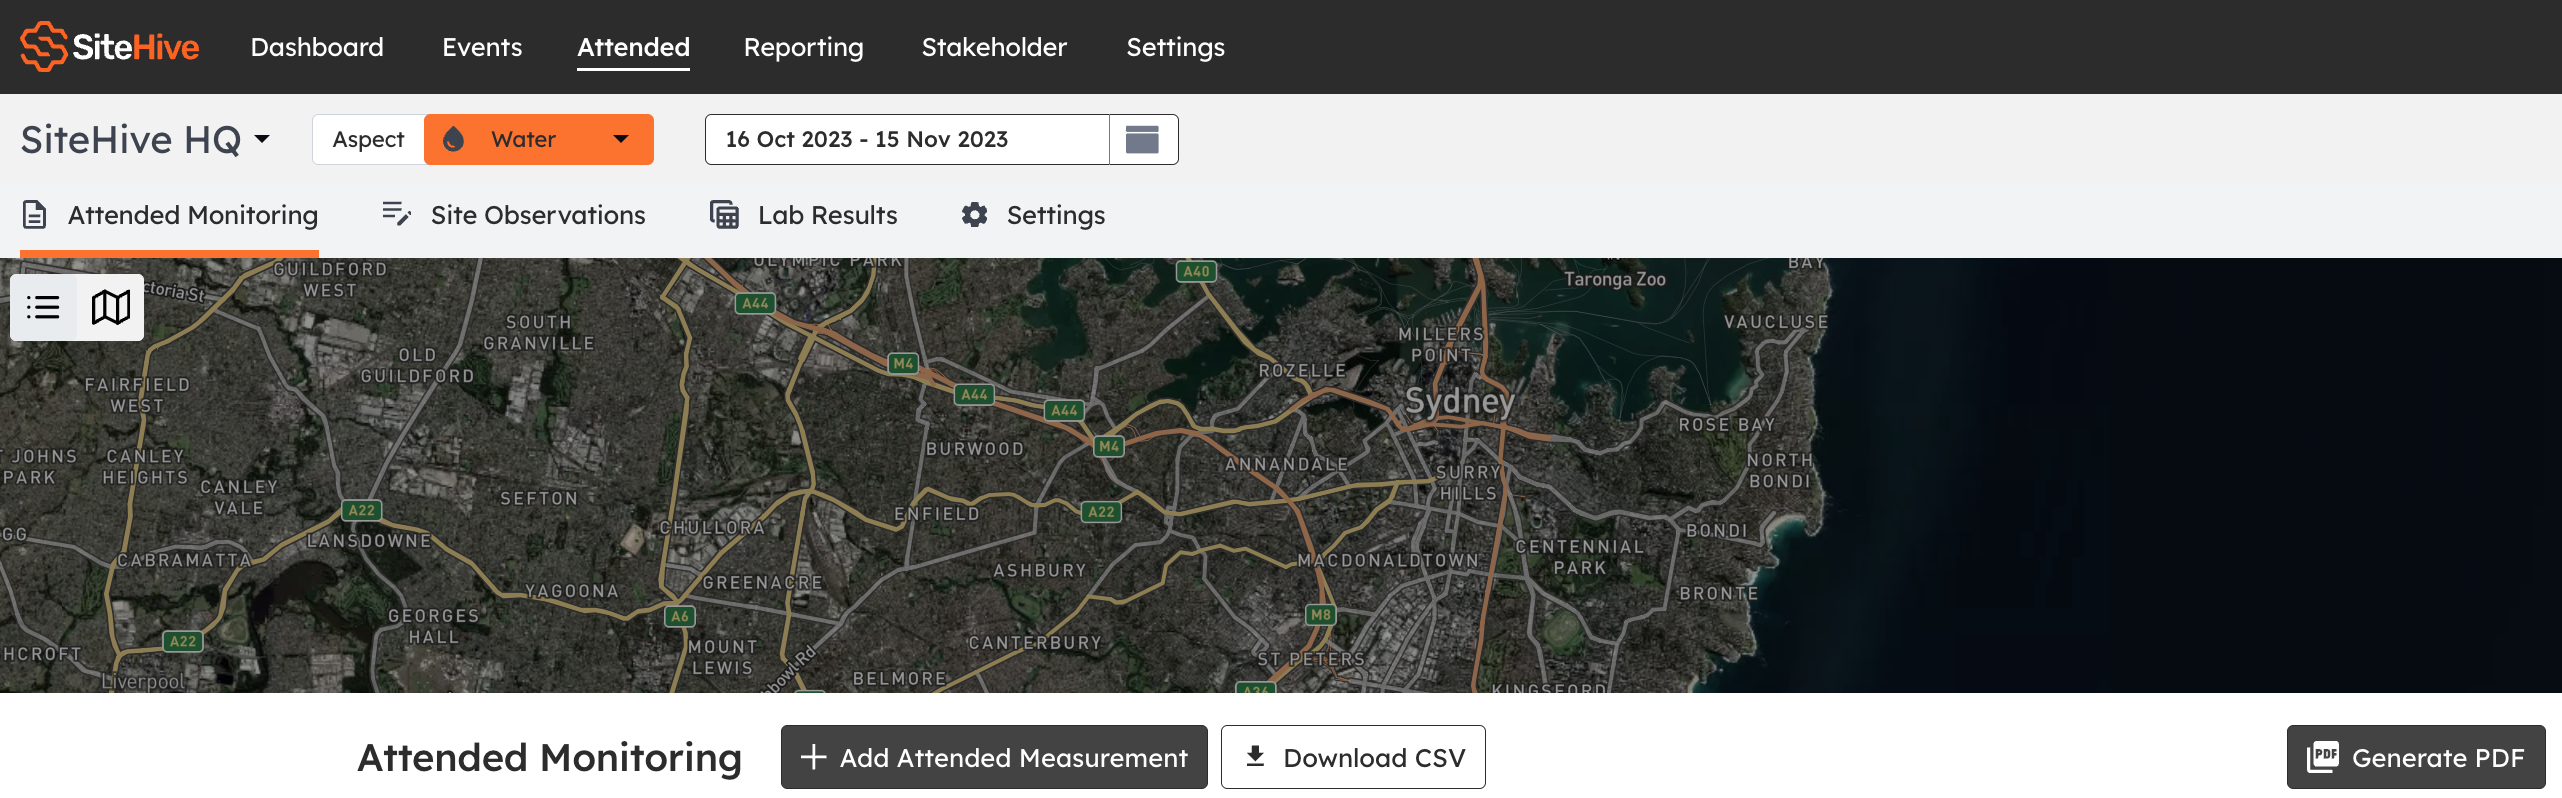
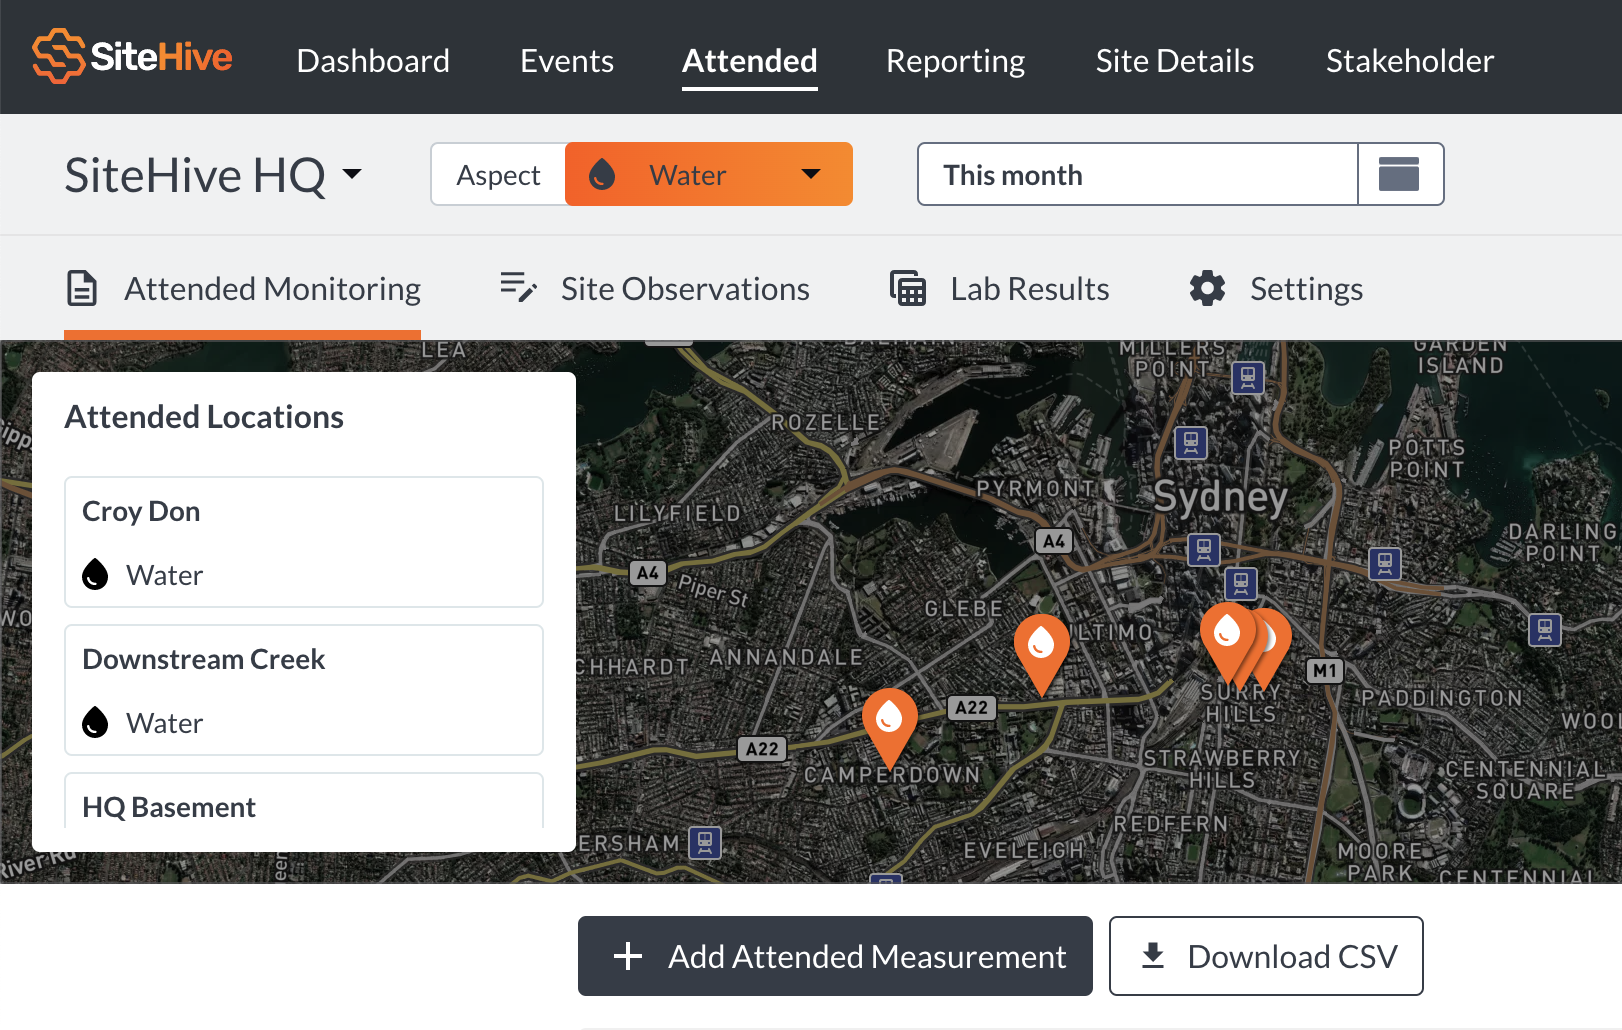
- Click 'Attended' on the top menu bar
- Next look to the second menu bar underneath your project name and click the 'Attended Monitoring' tab
- Click the '+Add attended measurement' button
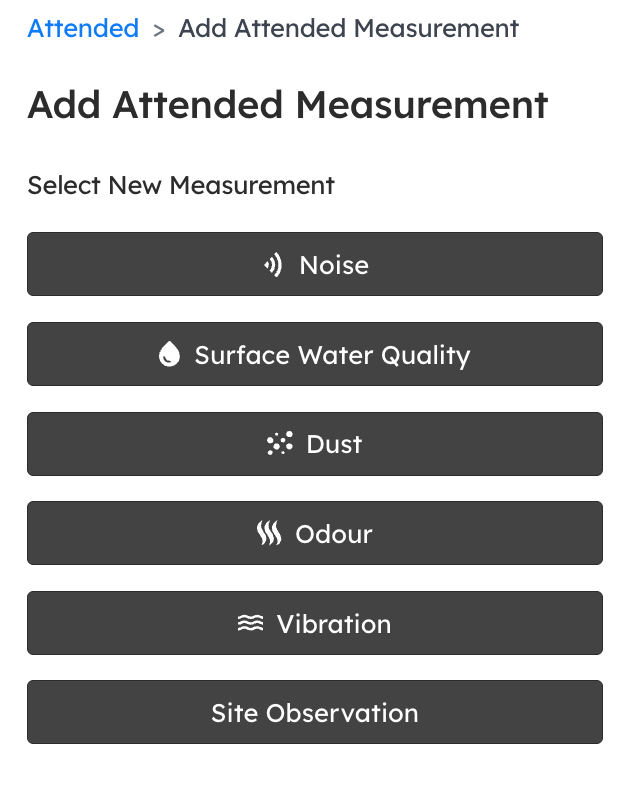
- Select the attended measurement
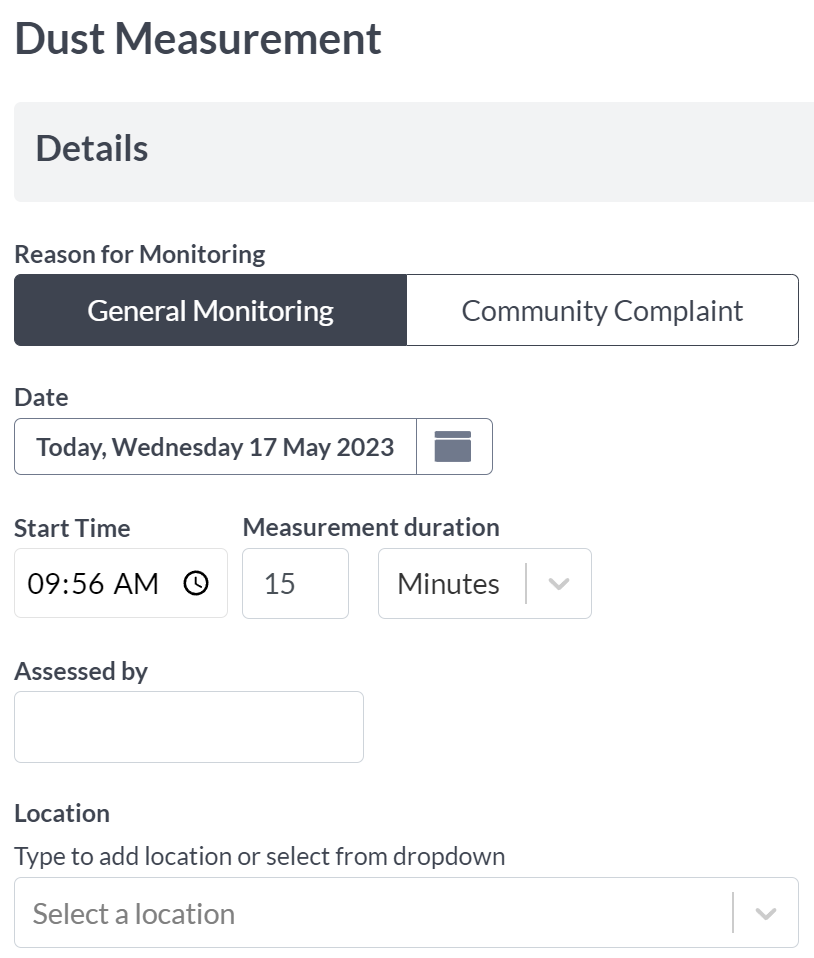
- This will take you directly to a form allowing you to manually enter the data from this measurement
Add additional details with notes
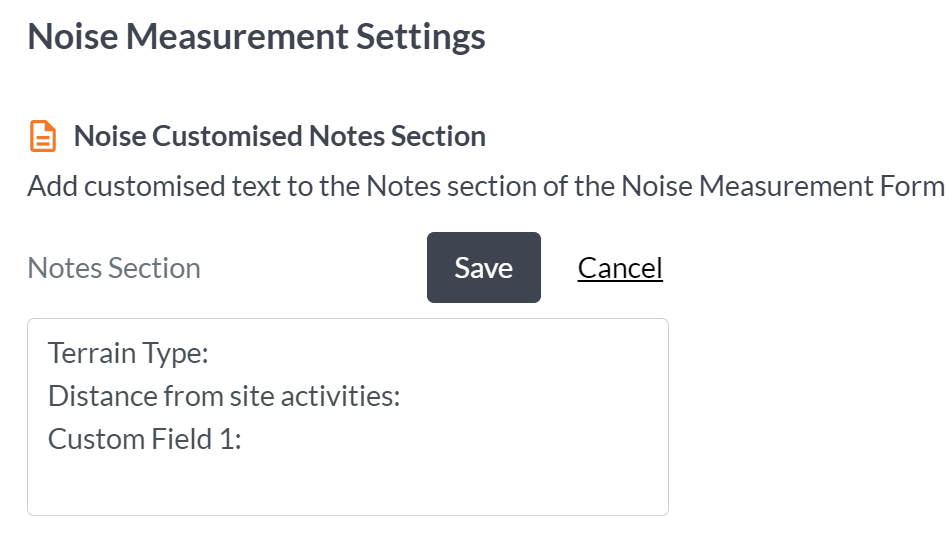
We have a dedicated section called 'Notes' that offers customisation options directly from the main dashboard under settings.

This feature allows you to include additional details that may not be captured in the original form. By editing the Notes section in settings, you can specify the text that will automatically appear each time in the Notes field. This eliminates the need for manual entry on every occasion.

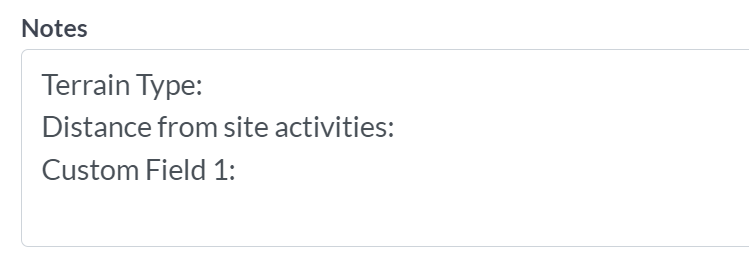
For instance, when measuring noise levels, you may want to include information about the terrain type and the distance from site activities. By editing these details in settings, they will be automatically populated in your form every time, saving you time and ensuring consistency.

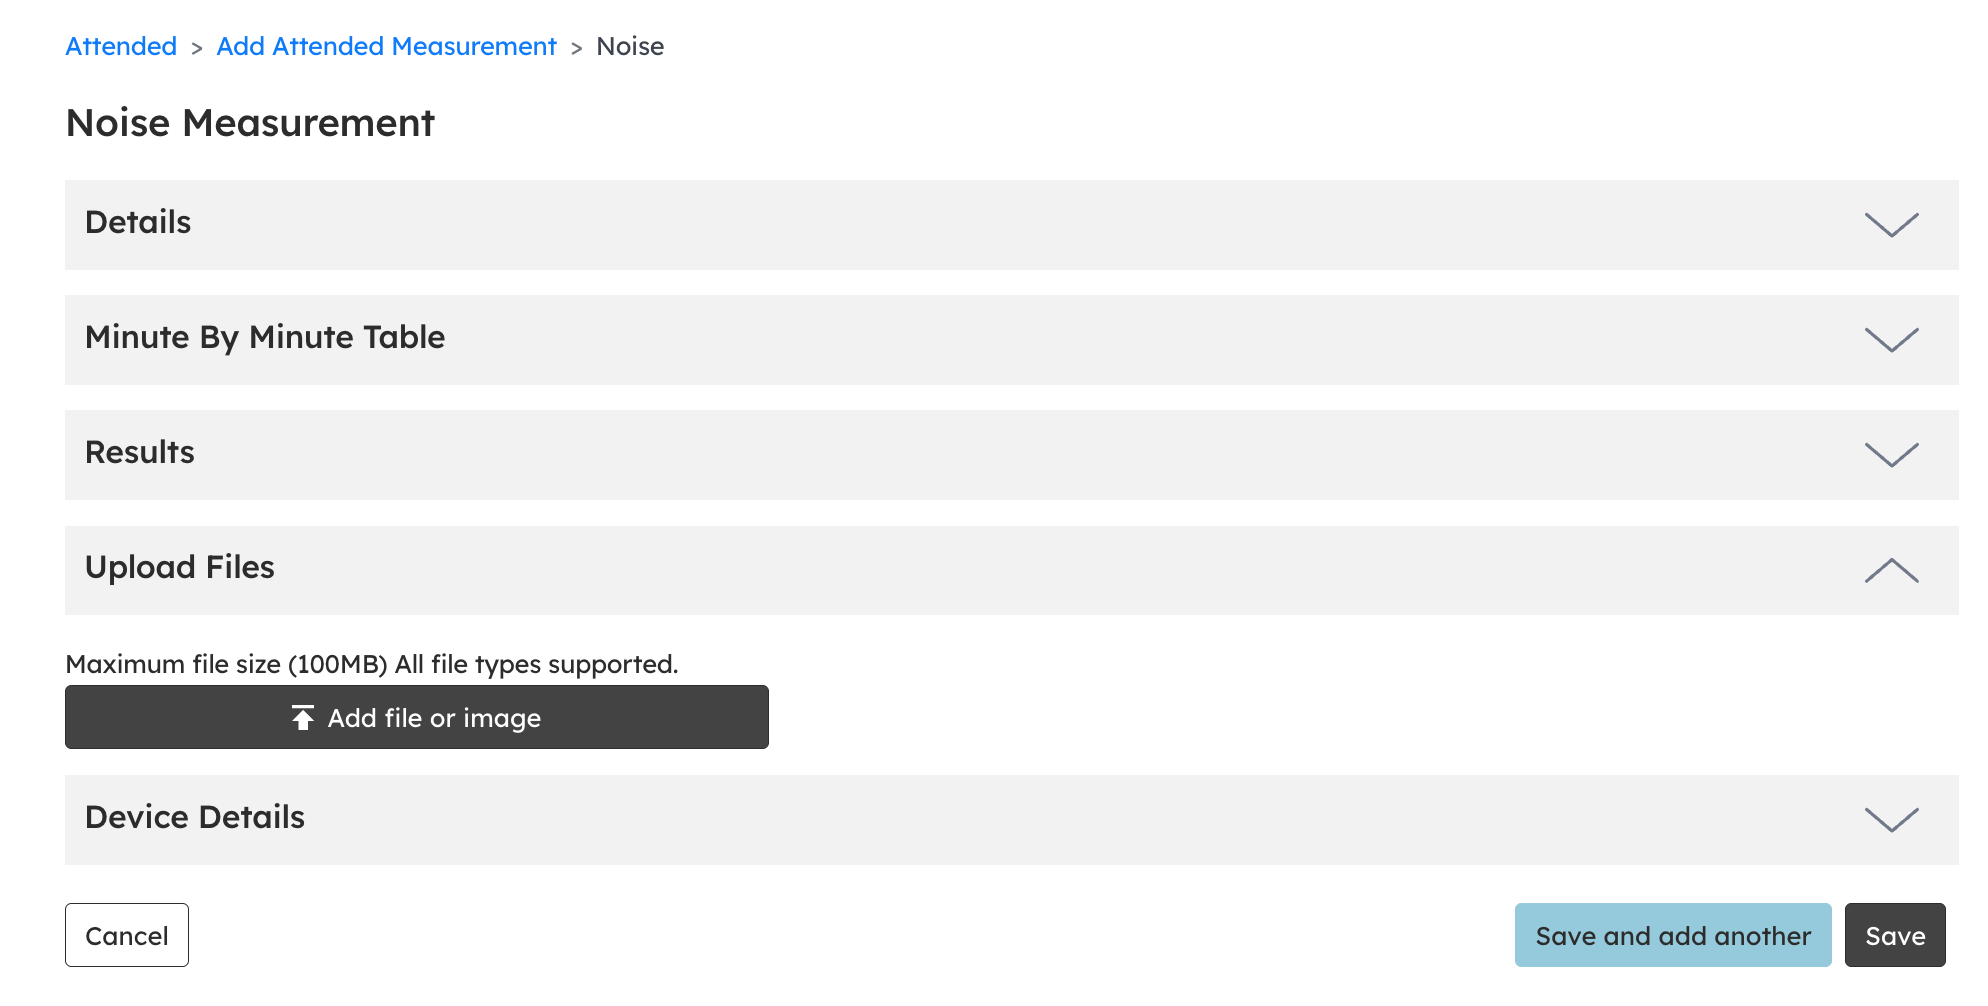
Upload files
In the notes section, you can easily add files or images to the attended monitoring points. This handy feature lets you have visual evidence alongside your data.
Generating a PDF
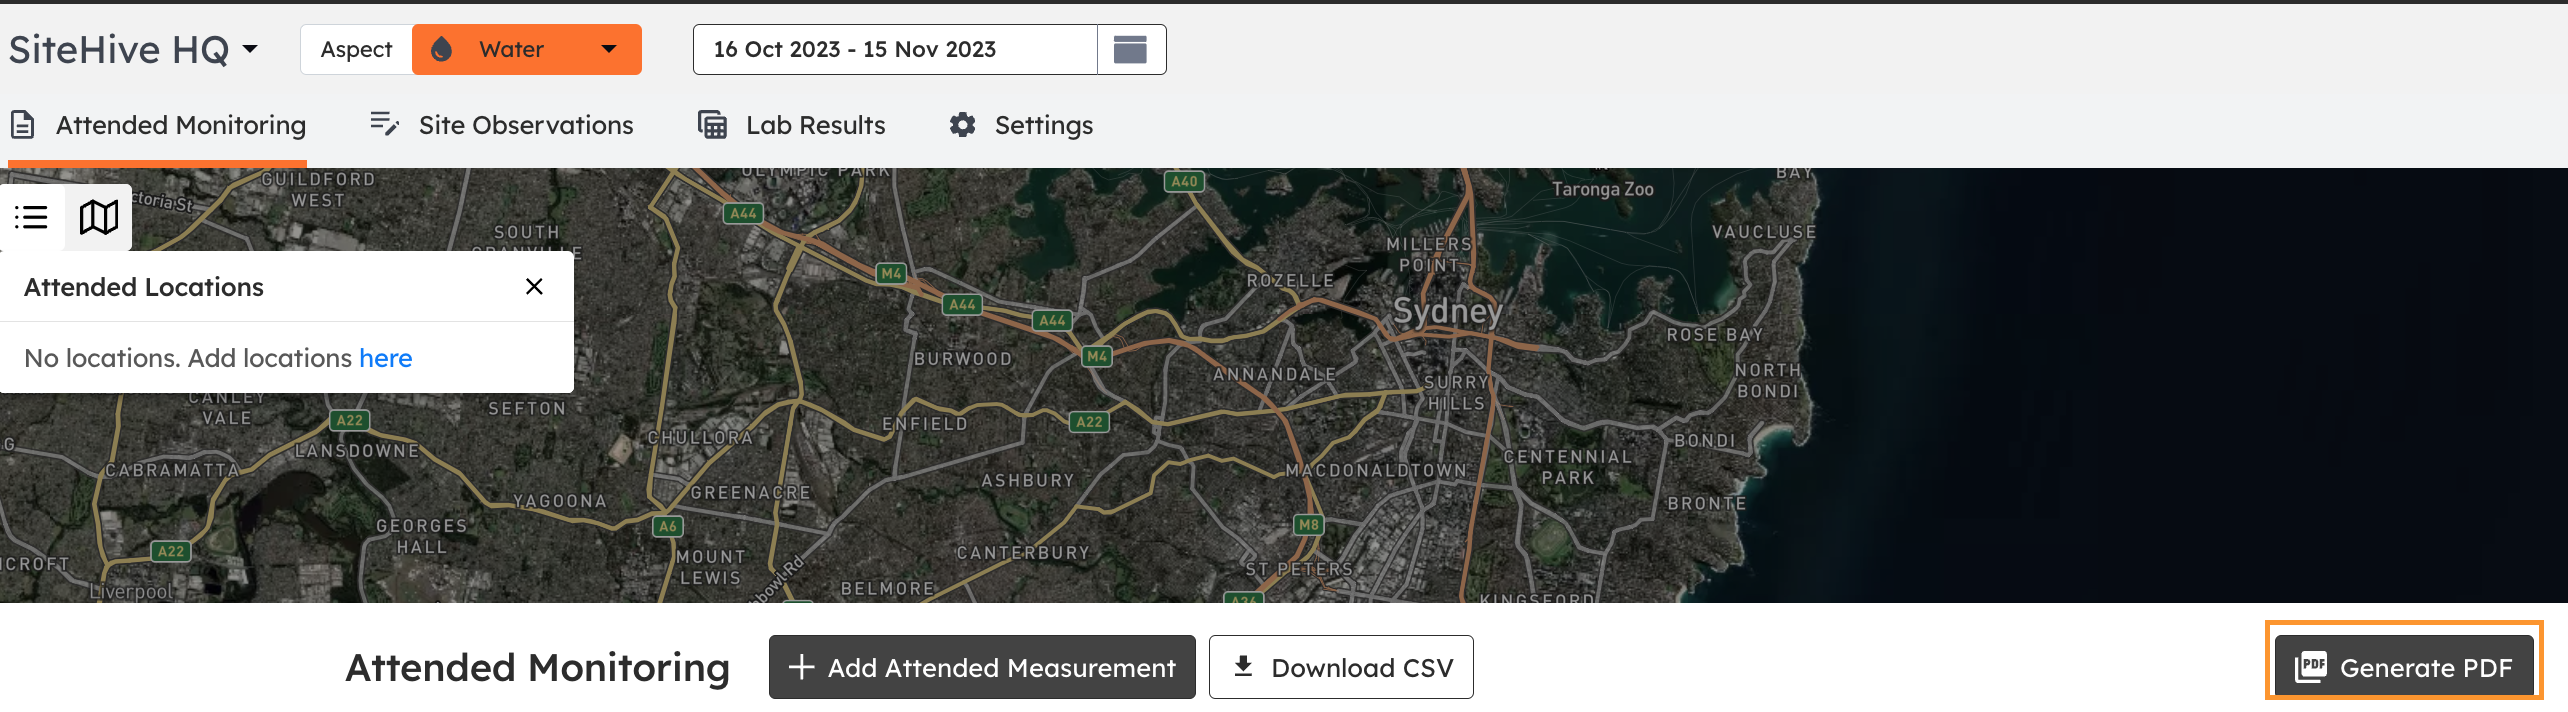
In Attended Monitoring, you also have the option to generate a customised PDF of your data.
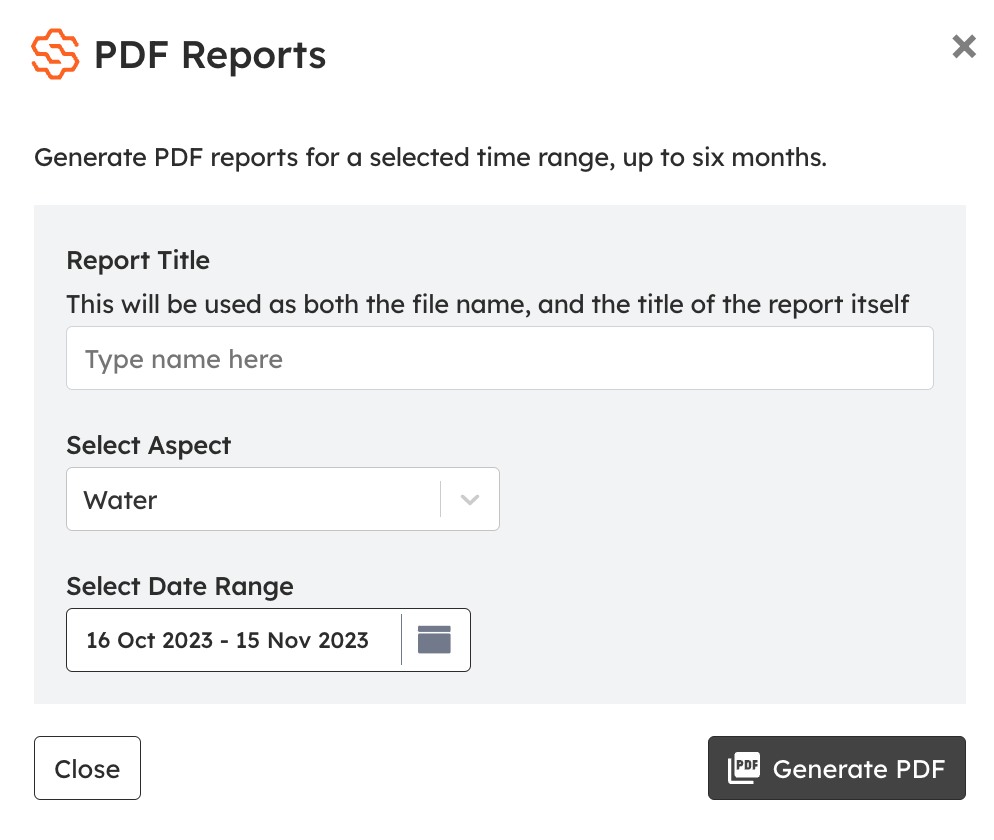
This can be tailored based on the aspect and date range you choose.
Visualise your data with graphs
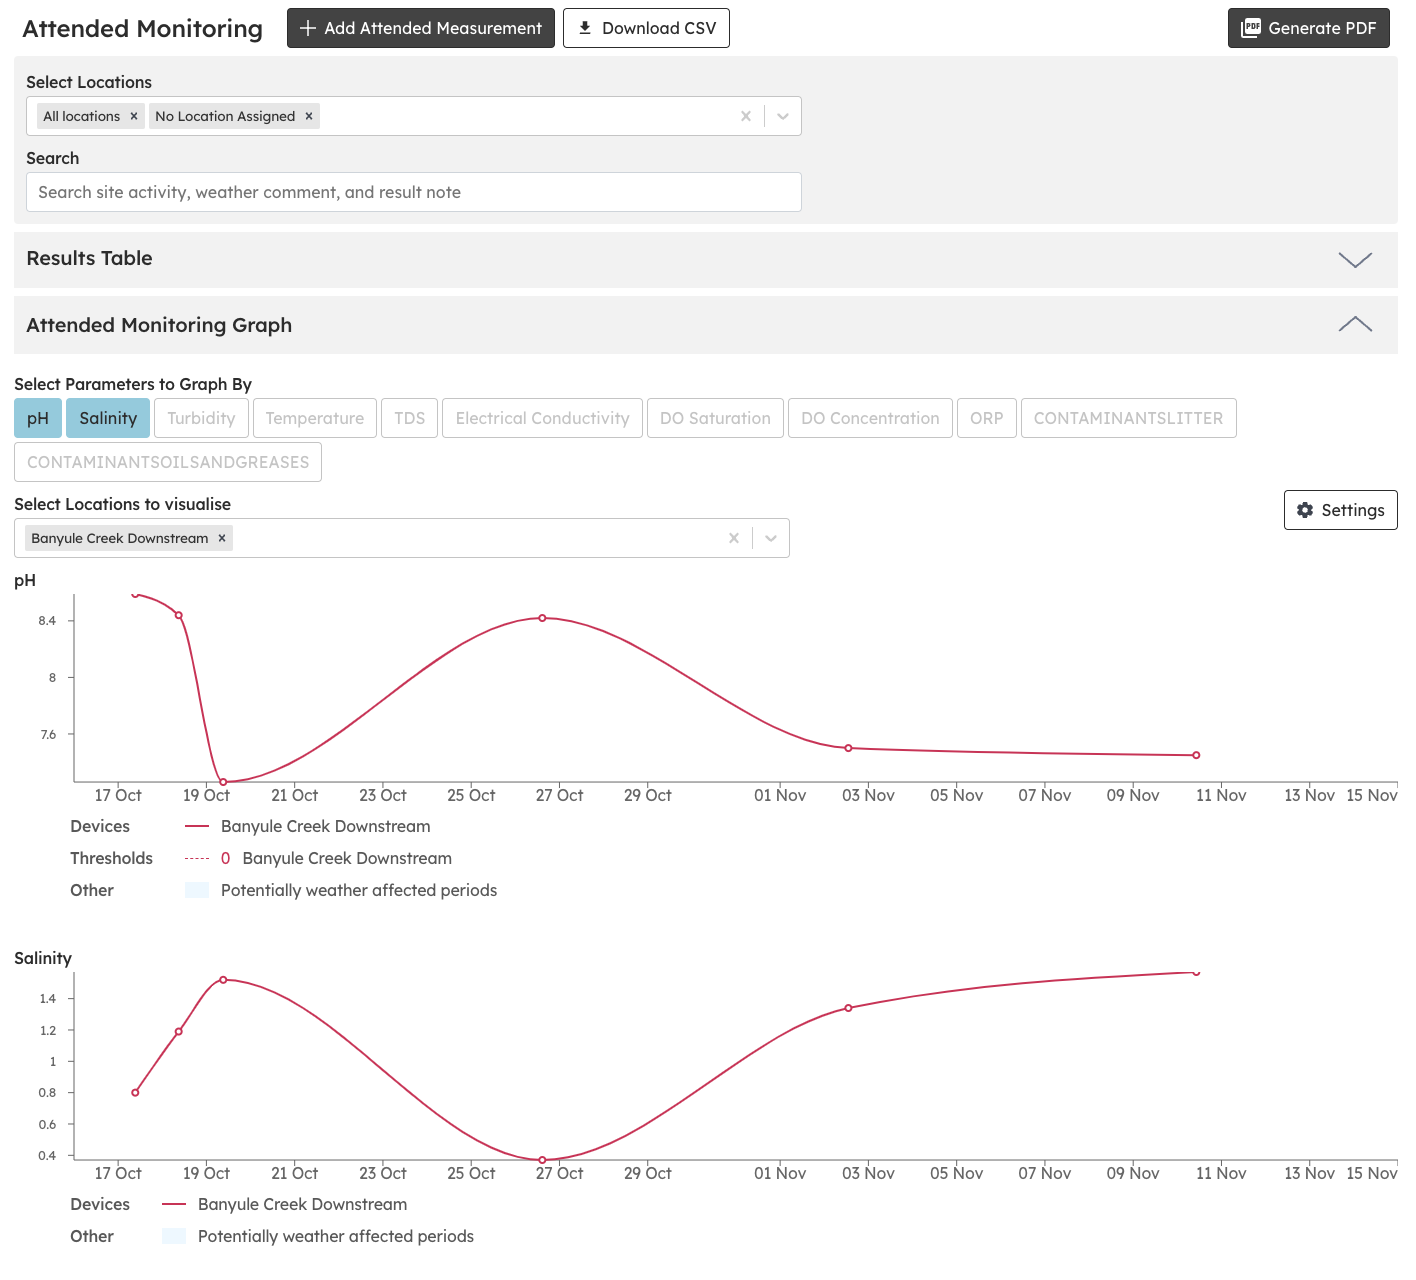
We also provide a graph feature, that presents Attended Monitoring results in a clear and concise graph format. This feature enables easy comparison of trends over time and across different locations, allowing you to gain valuable insights.
You can conveniently filter locations and compare parameters on the graphs.
Navigate the app
To begin, simply click on the Attended tab in the top navigation menu of SiteHive. You will be presented with a map displaying all Attended locations categorised by Aspect. From there, you can explore the following options:
- Attended monitoring: Access tables and graphs displaying results categorised by Aspect (Water, Noise, Dust, Odour). You can also add new measurements and conveniently download data in CSV or PDF Format.
- Site observations: Capture general site notes and observations, along with locations and images
- Lab results: Automatically process Water lab results, and apply ANZG thresholds to triage results
- Settings: setup and manage devices, locations and thresholds (by location)
Add attended measurement
After clicking add attended measurement, you will be taken to this page ➡️ Attended > Add Attended Measurement.
From here you will select the attended measurement e.g. Dust.
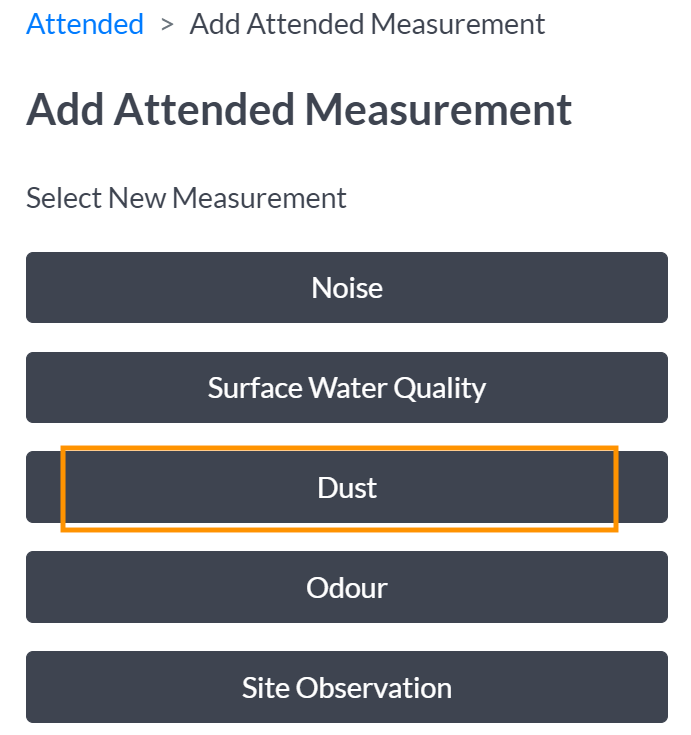
This will take you directly to a form allowing you to manually enter the data from this measurement.
Add additional details with notes
We have a dedicated section called "Notes" that offers customisation options directly from the main dashboard under settings.

This feature allows you to include additional details that may not be captured in the original form. By editing the Notes section in settings, you can specify the text that will automatically appear each time in the notes field. This eliminates the need for manual entry on every occasion.
For instance, when measuring noise levels, you may want to include information about the terrain type and the distance from site activities. By editing these details in settings, they will be automatically populated in your form every time, saving you time and ensuring consistency.
Upload files
In the notes section, you can easily add files or images to the Attended monitoring points. This handy feature lets you have visual evidence alongside your data.
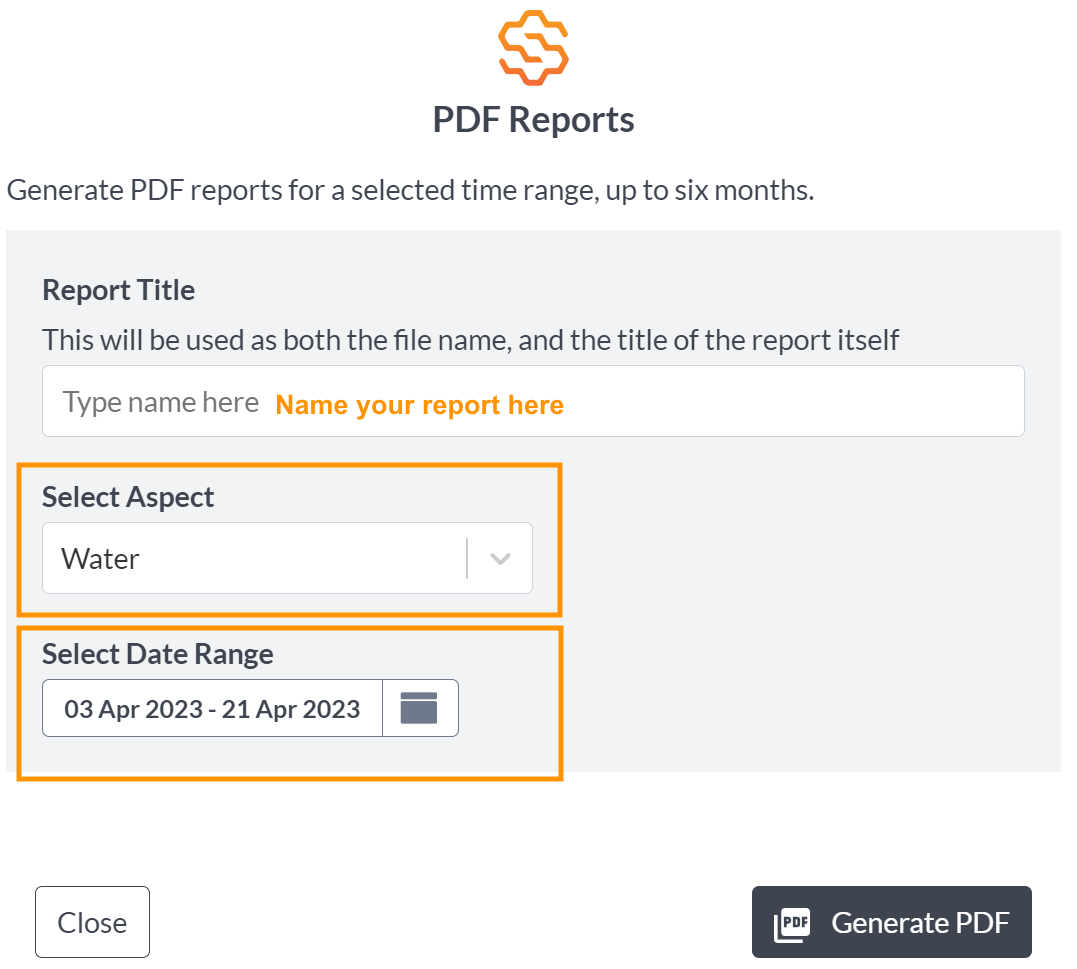
Generating a PDF
In Attended Monitoring, you also have the option to generate a customised PDF of your data.
This can be tailored based on the aspect and date range you choose, as shown below:
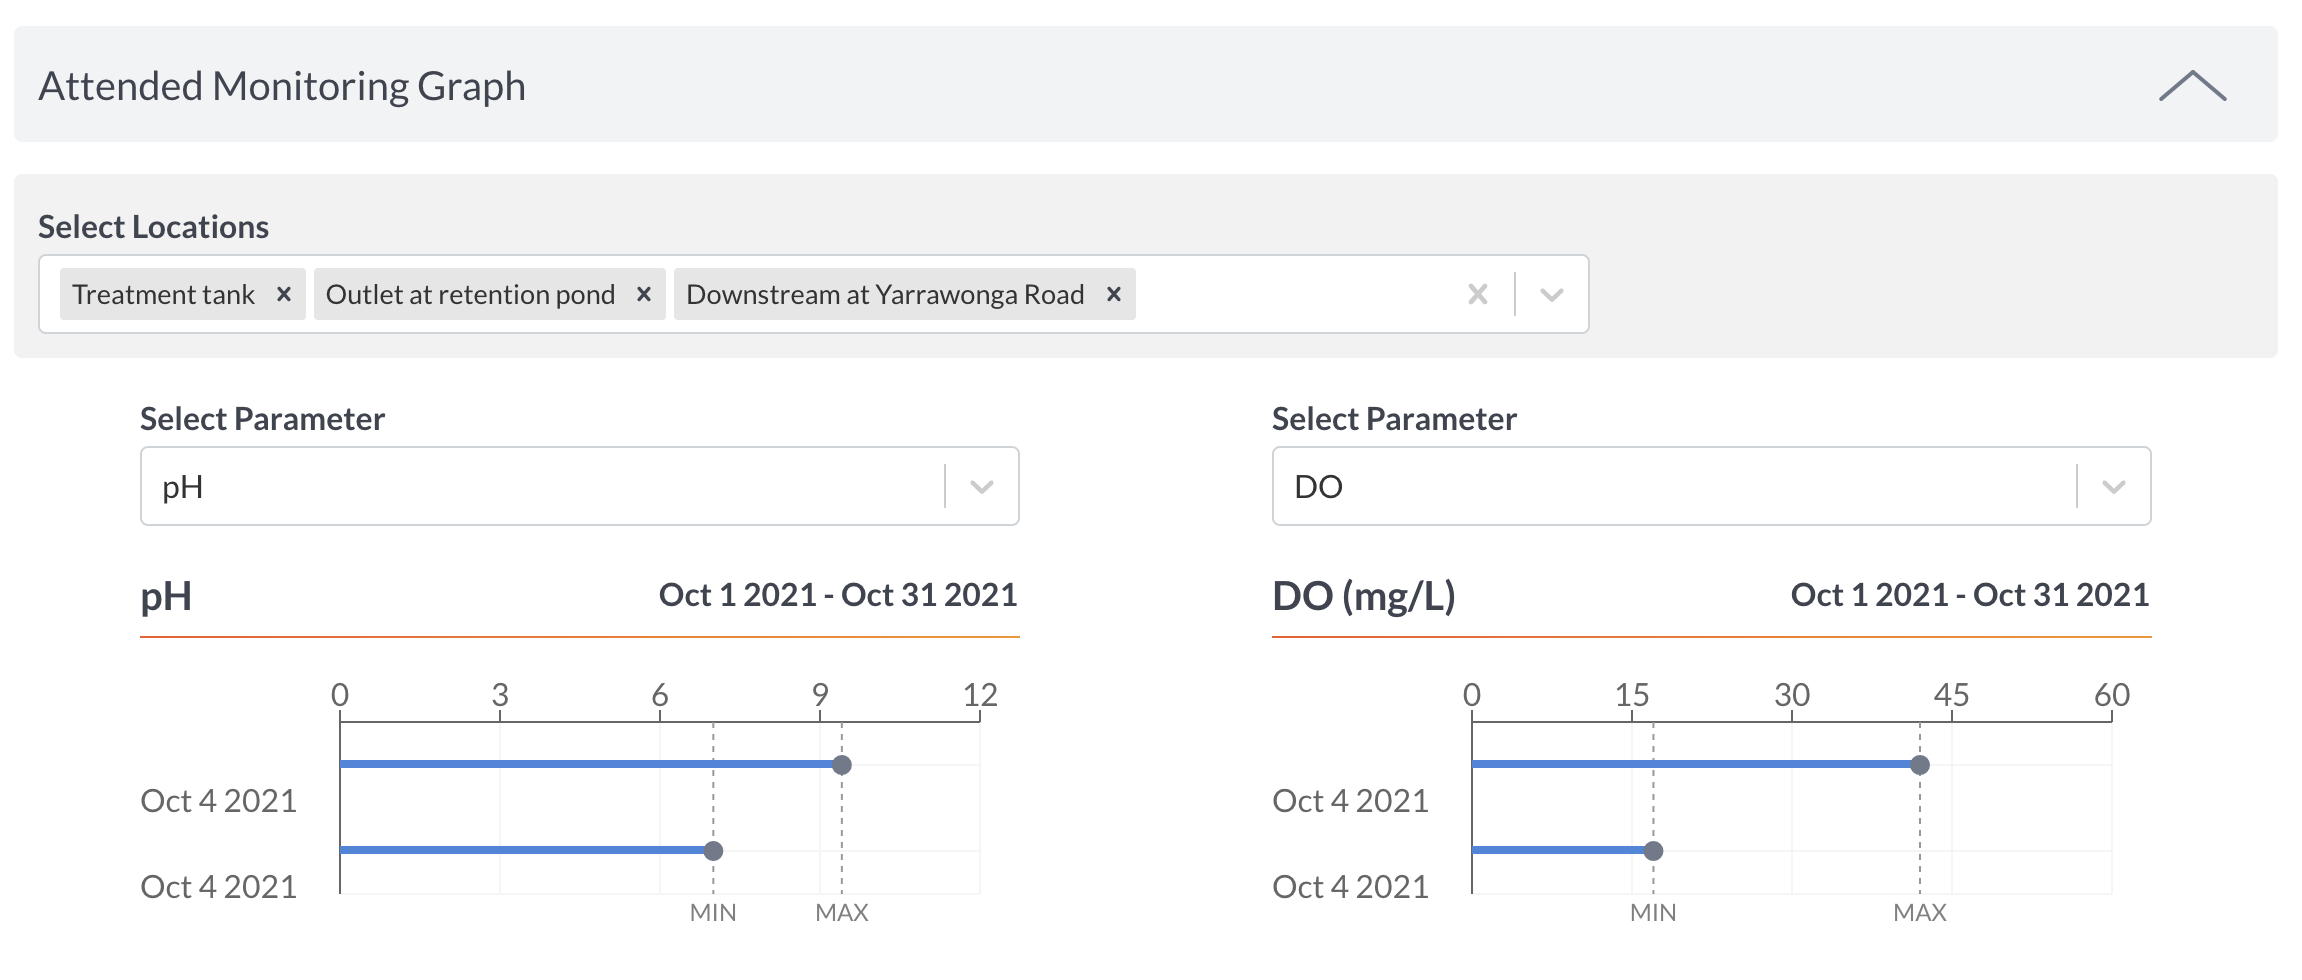
Visualise your data with graphs
We also provide a graph feature, visible in the map below, that presents Attended Monitoring results in a clear and concise graph format. This feature enables easy comparison of trends over time and across different locations, allowing you to gain valuable insights. You can conveniently filter locations and compare parameters on the graphs.
The table displays the complete range of attended measurements, including lab results for water. It provides key details for each measurement, allowing for easy reference and analysis.
Additionally, any personally added attachments are conveniently accessible within the table, ensuring quick access to supporting documents or files.
Install the SiteHive web app to your Phone
For easier & better use of SiteHive Enviro Pro in the field use your phone. We recommend adding it to your phone homescreen - so it launches full screen & remembers your log-in and site selection. Learn how to do this here.