
Audio Classifier
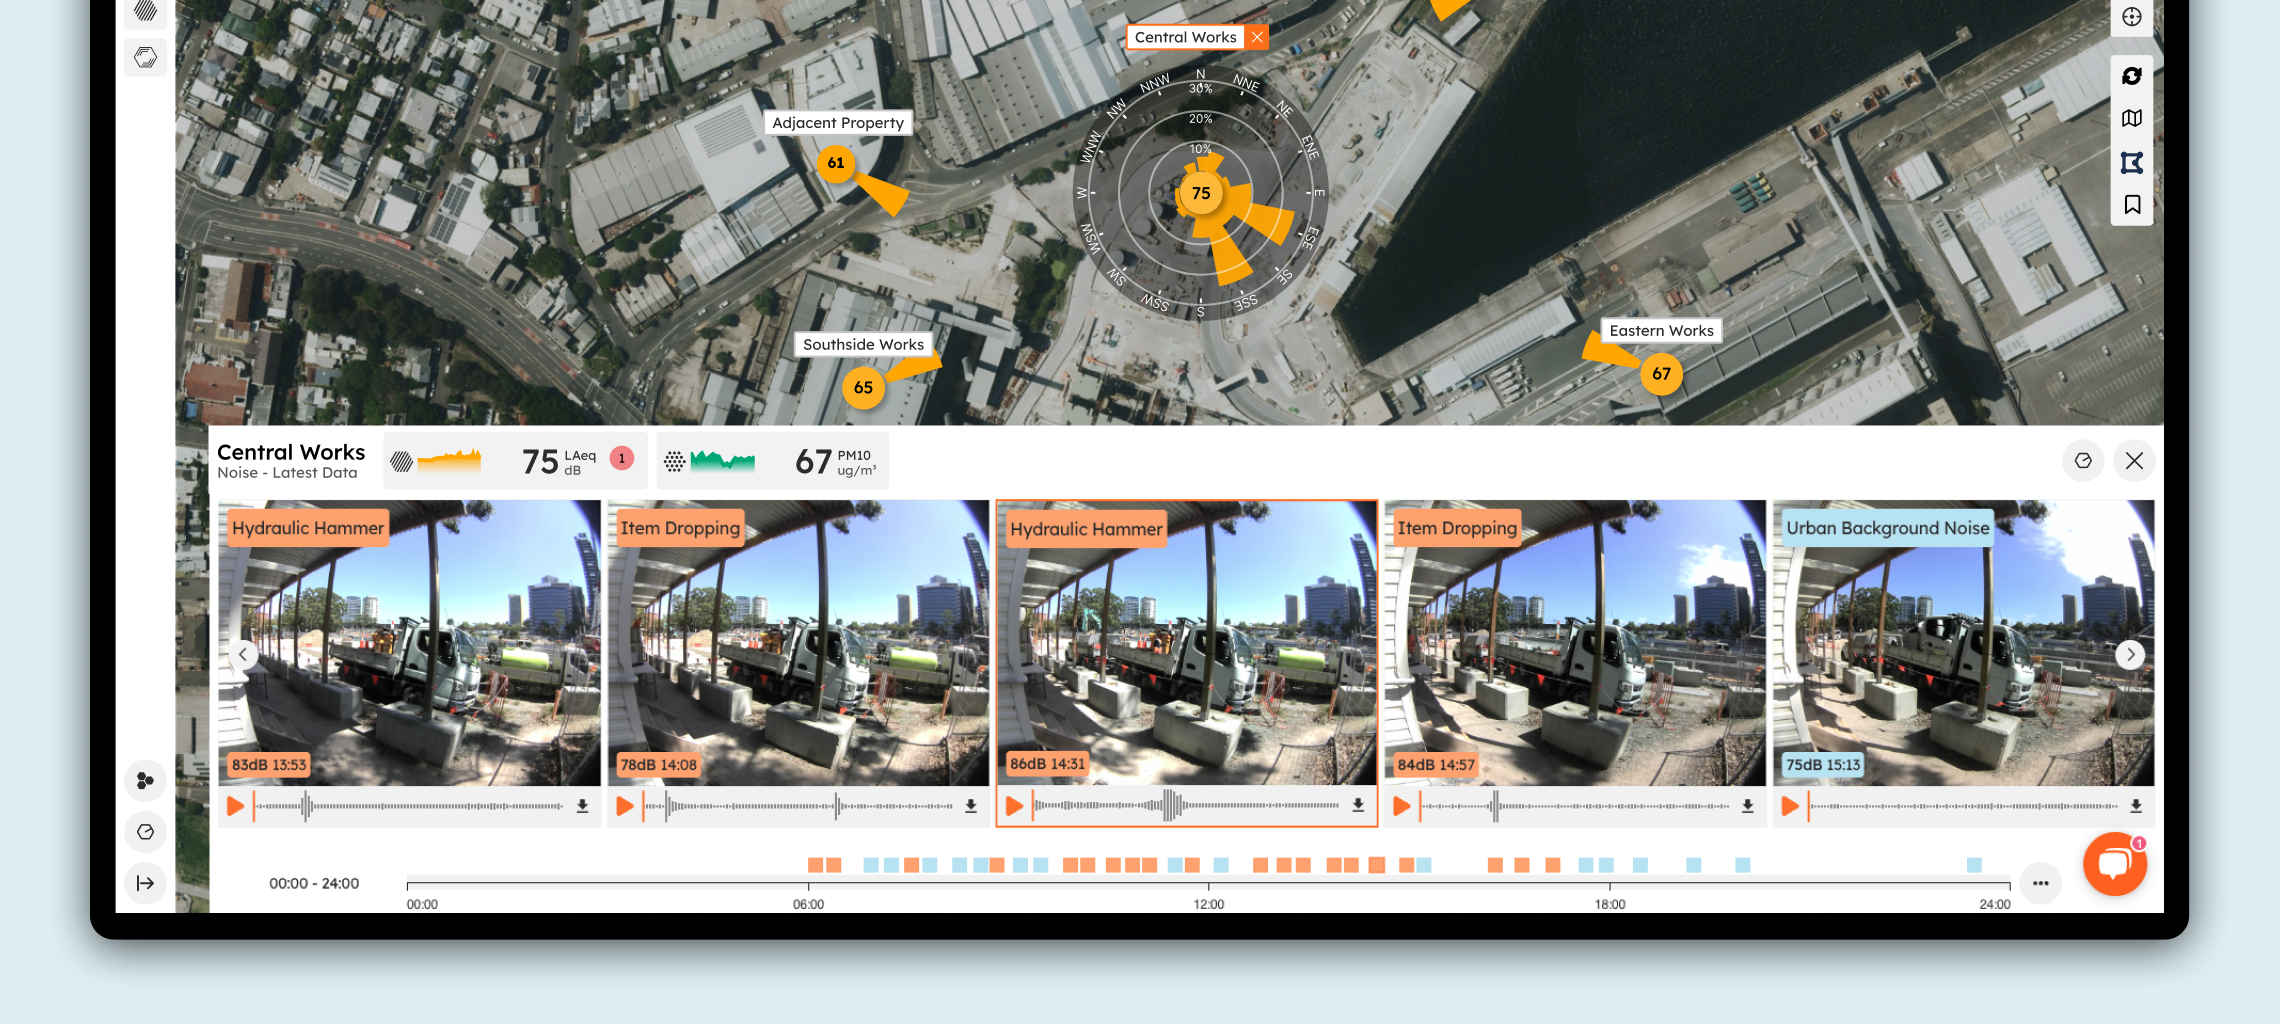
Harnessing the power of AI, the SiteHive Audio Classifier automatically identifies site sounds so that you don’t have to. It's a groundbreaking tool that's integrated into SiteHive Enviro Pro, and it uses advanced AI technology to analyse and identify the source of noise. The Audio Classifier is designed to help Environmental Managers save time and efficiently monitor and control noise by eliminating the need to manually listen to and analyse audio files. See it in action on the Dashboard - in the media timeline section at the base of the screen.
We are continually improving and innovating based on this revolutionary technology, and here are its key features:
Automatic identification: Instantly identifies noise sources, and colour codes them based on whether they are construction related or not.
Real-time analysis: Analyses noise events in real time by classifying audio files captured by SiteHive Hexanode Devices.
Comprehensive noise database: Compares captured sounds to a vast database of sounds to determine the likeliest noise source.
Instant labels: Provides clear, instant labels for each audio file, making it easy to differentiate between site-generated noise and external noise.
Benefits of using the Audio Classifier
Time-saving: Avoid the time-consuming task of manually listening to audio files.
Trend analysis: Quickly identify trends in noise events throughout the day.
Immediate source identification: Easily determine if noise, dust, or vibration is caused by site activities.
Noise contribution analysis: Understand the contribution of site works to overall noise levels.
Automated reporting: Simplify compliance reporting with automated explanations for noise events.
How to use the Audio Classifier
Go to SiteHive dashboard and:
Select the Monitoring Point
If there is media for that Monitoring Point, on that day, the Media Section will appear in the bottom bar of the Dashboard (also in the Media tab on Graph View)
Review Imagery & Audio Files, simply by clicking and dragging the media left & right, or by using the left & right arrows at the edge of the media slider
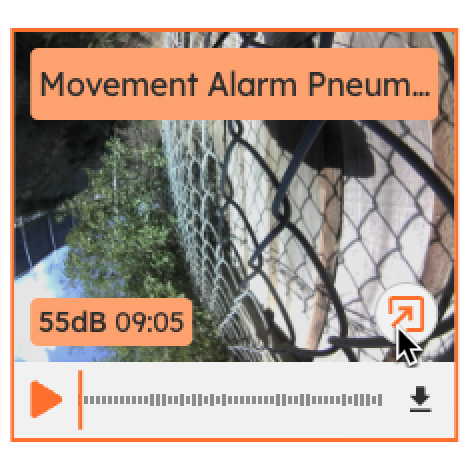
Each audio file has one label indicating the predicted sound source , e.g., "Hand Tools" or "Heavy Plant or Vehicle."
If label is orange this indicates a Construction related audio file, blue non-construction related, grey - it doesn't have a clear classification so indicates no classification.
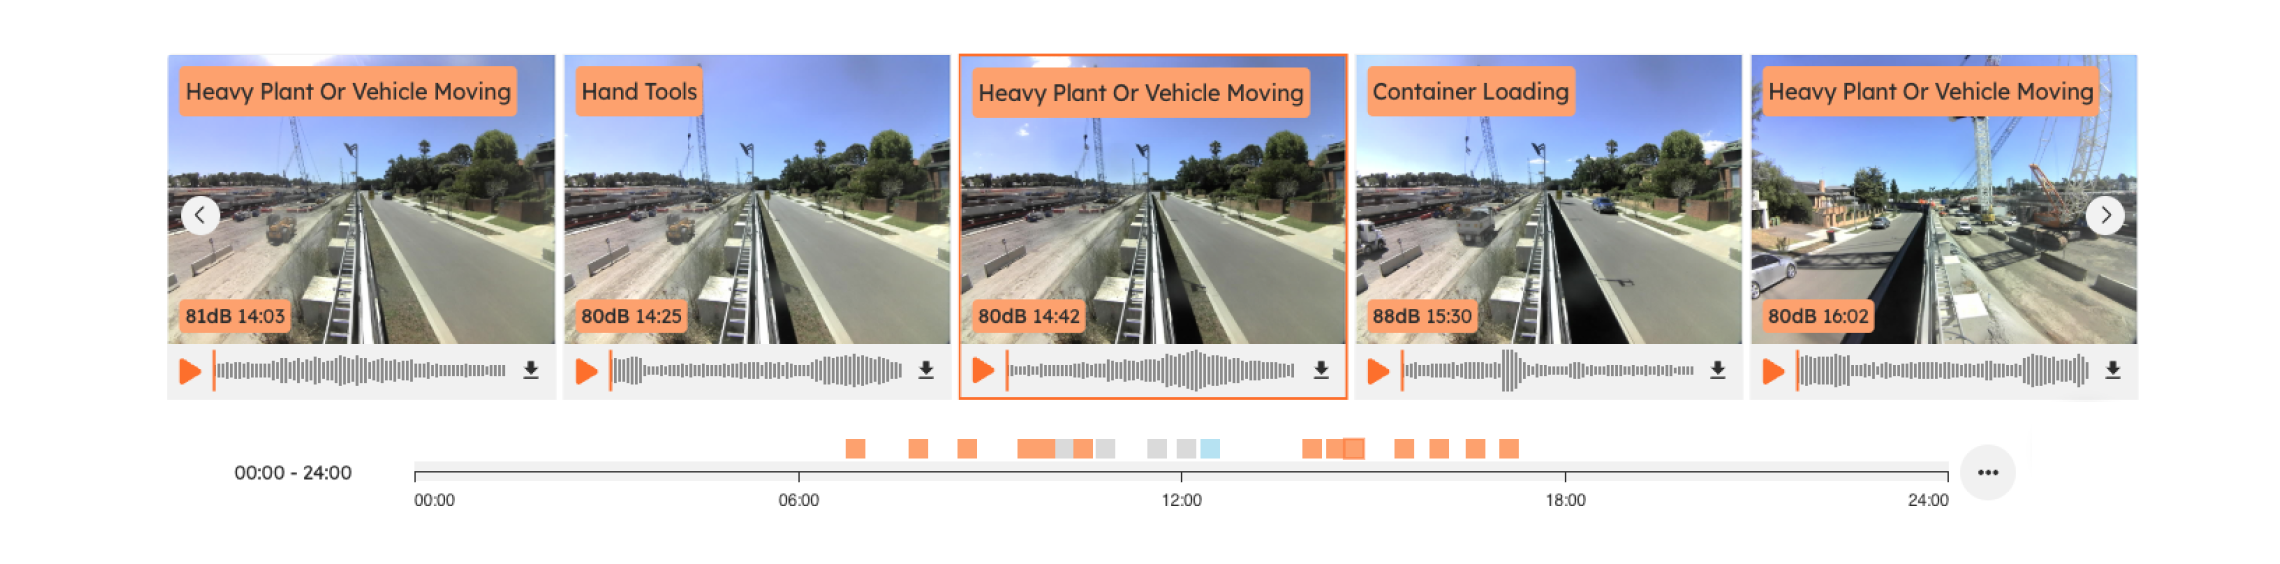
The timeline beneath media indicates when media is captured by little colour coded squares. Click on any of these to select the related media element.
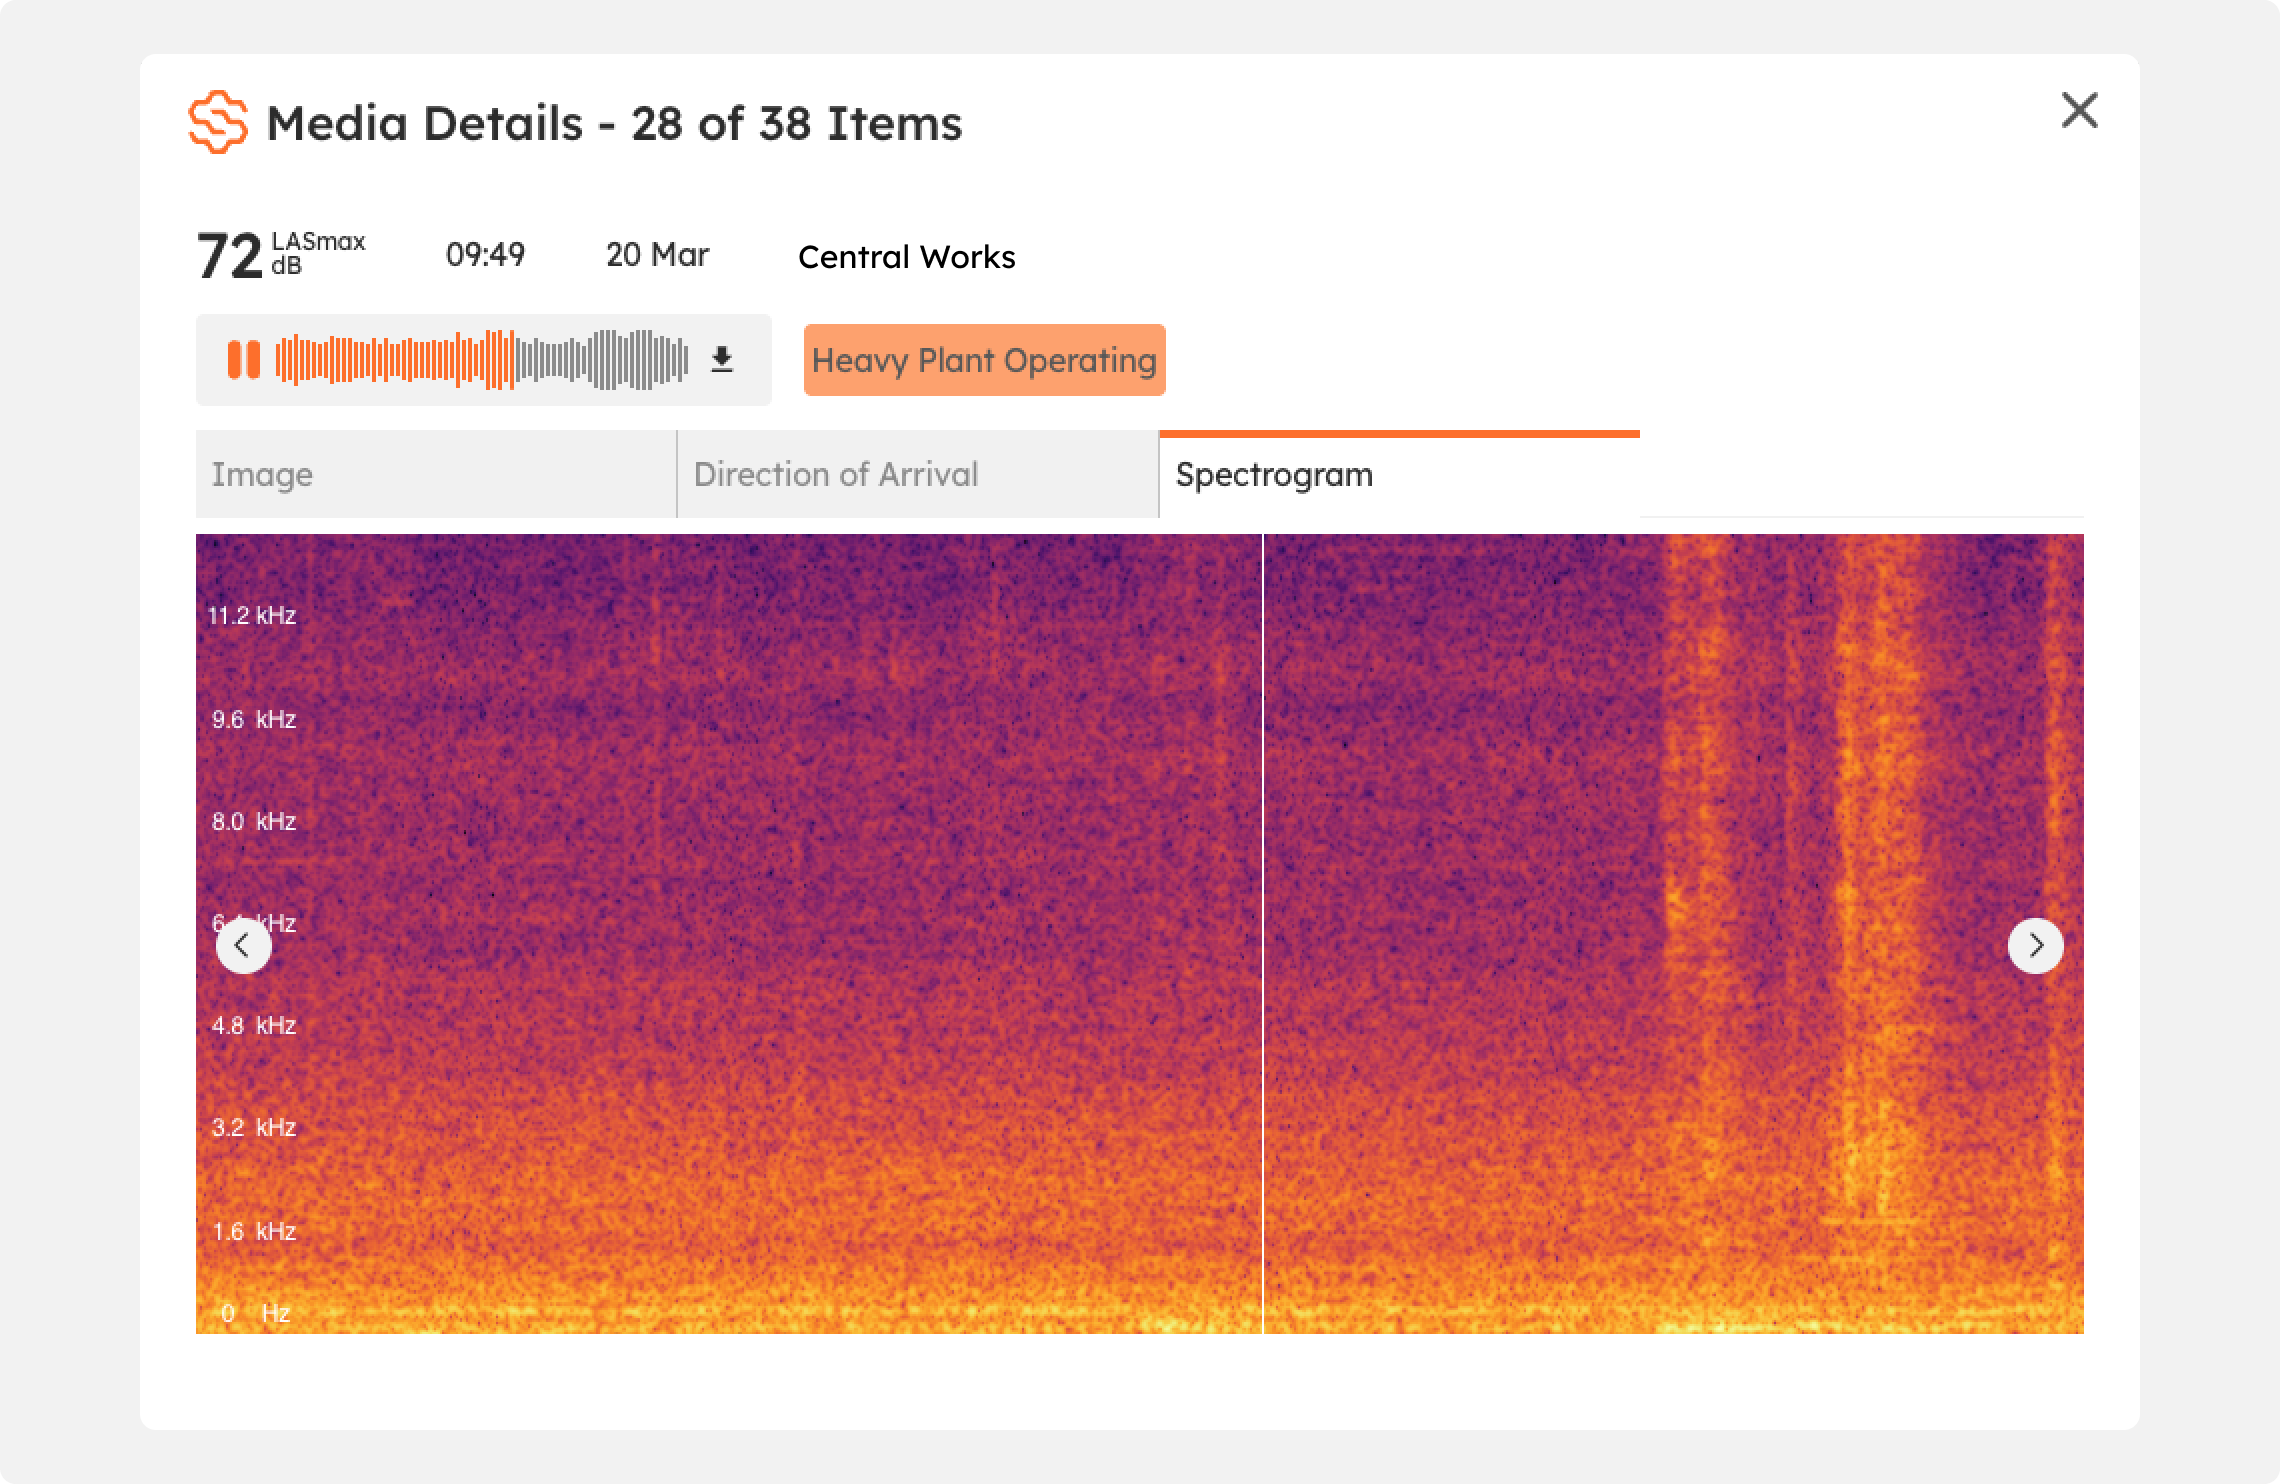
Explore Media Details
Double click on the Media image, or click media icon bottom right of the photo.
This opens the Media Details window - where the audio & imagerycan be explored in more detail and additional associated classifications are shown. Also there are tabs for seeing what Direction of Arrival the noise had, and a Spectrogram.
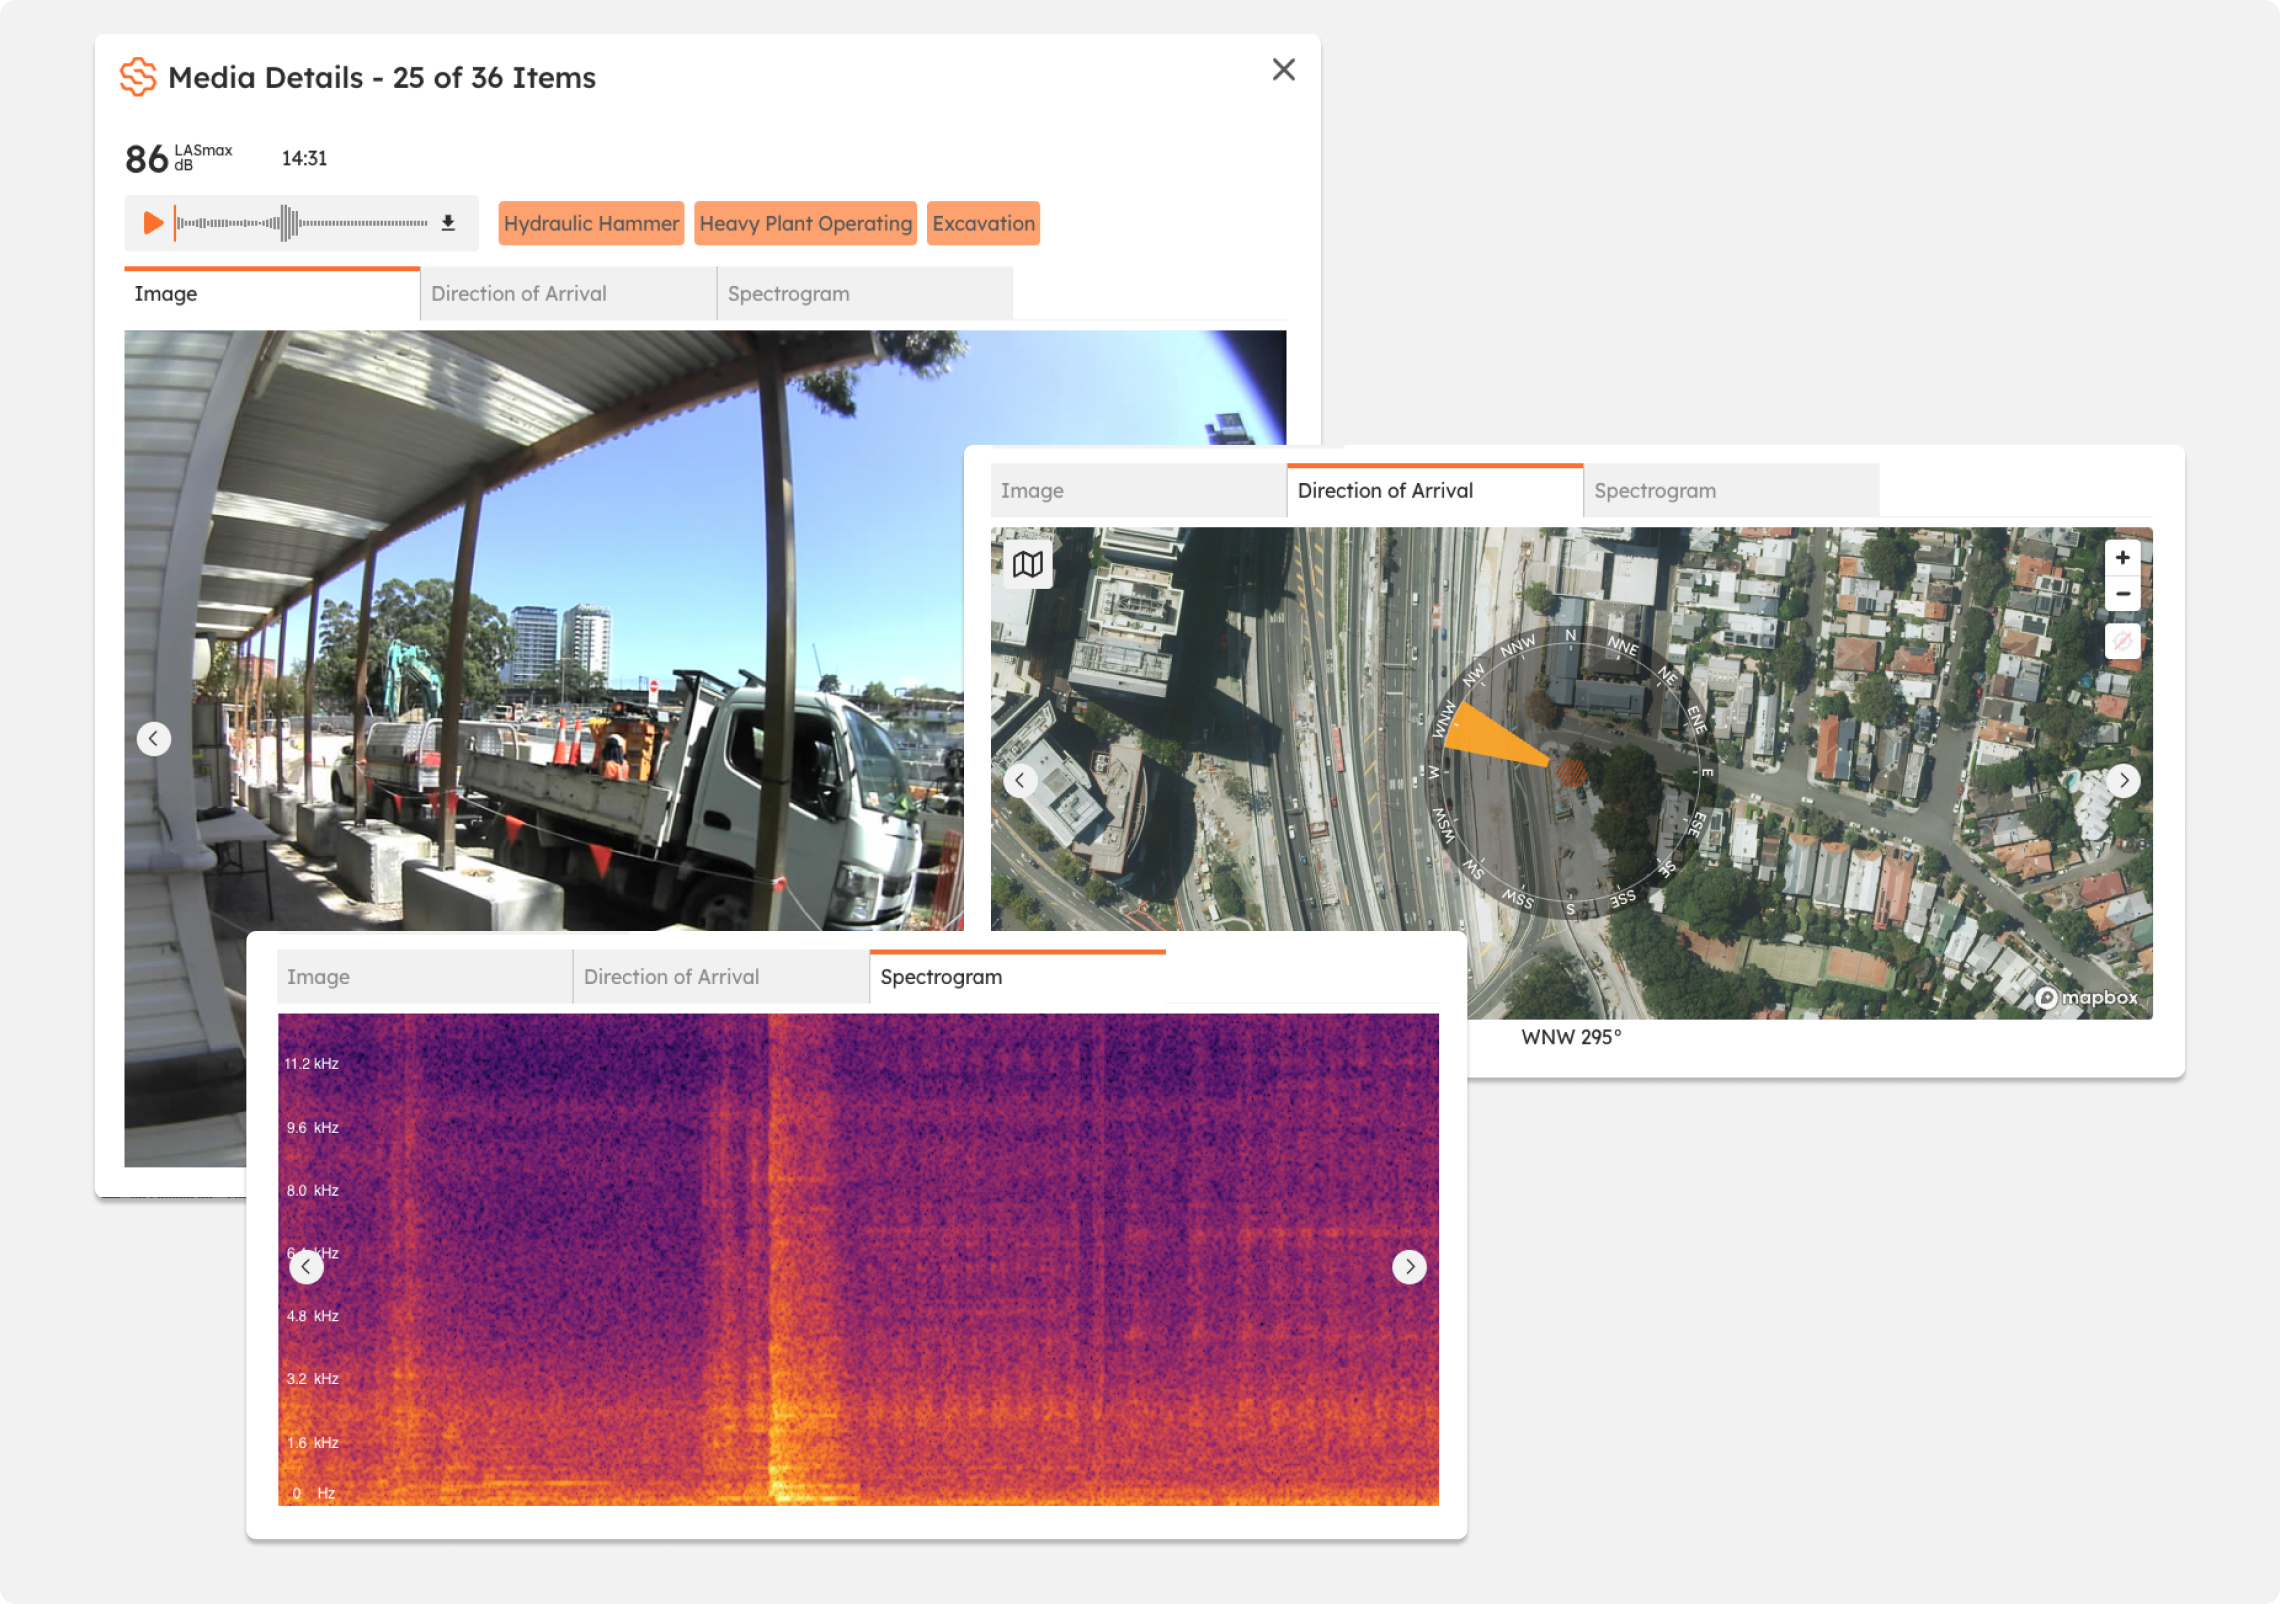
Classification confidence level
Each audio file in SiteHive Enviro Pro is classified against a broad database of known sounds. There are a range of top level categories, e.g. Human Activity, Animal Activity, Ports, Construction etc. Some categories, in particular the Construction category, then have deep subsets of labels that can classify for example exactly what is happening on site, for example it can tell whether plant is idling, operating, or even moving. Each file potentially has multiple labels, with the most dominant sound presented as the primary label in the media reel, and the first label in any list.
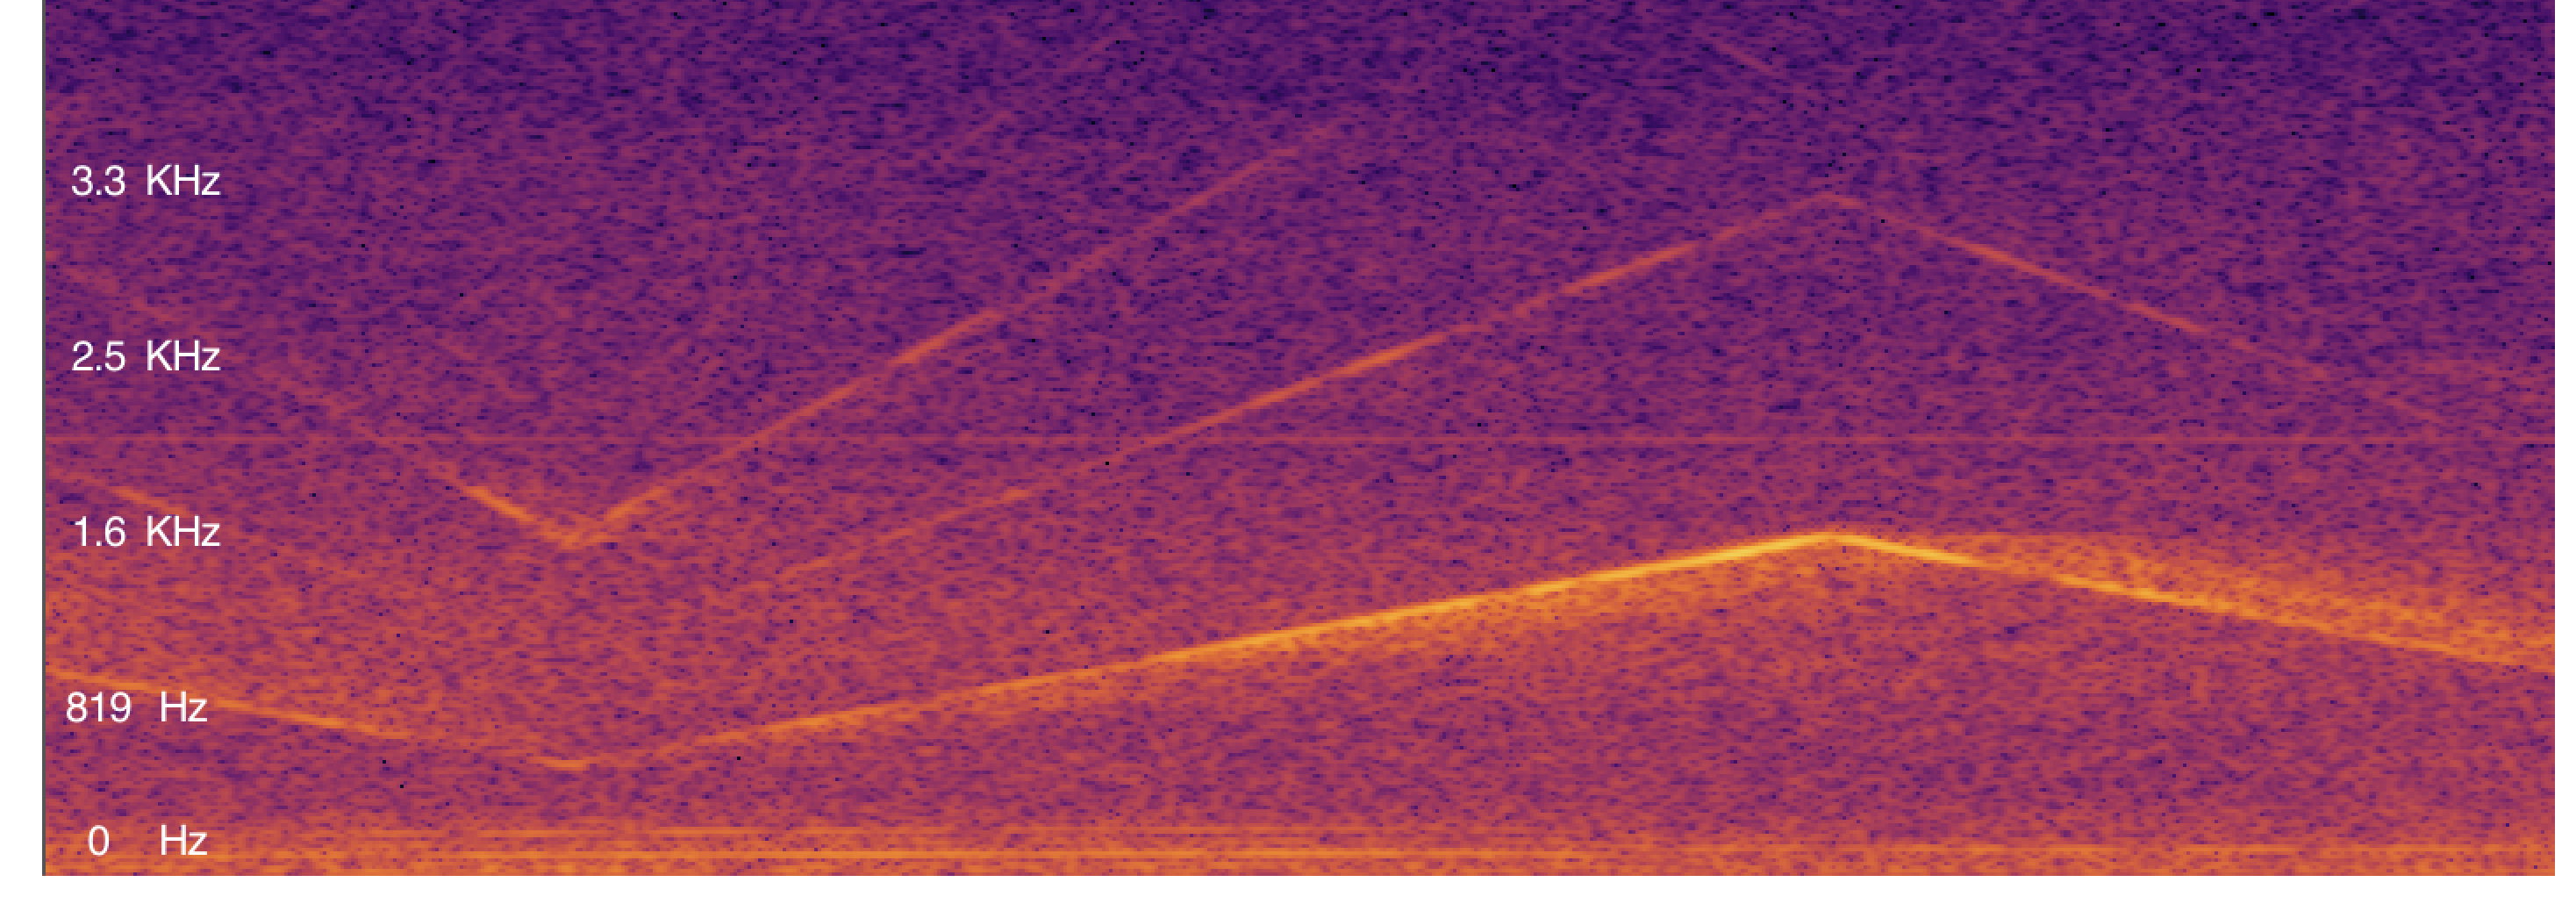
Understanding spectrograms
What is a spectrogram?
A spectrogram is a visual representation of the spectrum of frequencies in a sound or other signal as they vary with time. It provides a detailed view of the noise characteristics over a period, showing the intensity of different frequencies. In Enviro Pro, the spectrogram for each audio file can be found next to the camera images in the Spectogram tab. The SiteHive Audio Classifier is trained on thousands of audio files that we see and hear on sites every day.
Also, when you play an audio file - you've see a white vertical line move across the spectrogram from left to right. The x-axis is time, so this is showing when the audio is currently playing on the spectrogram.
Each spectrogram is shown as:
Time (X-axis): Represents the duration of the recording.
Frequency (Y-axis): Shows the range of frequencies from low to high.
Intensity (Colour): Indicates the loudness of each frequency. Brighter colours represent higher intensity.
Example of a spectrogram of a siren:
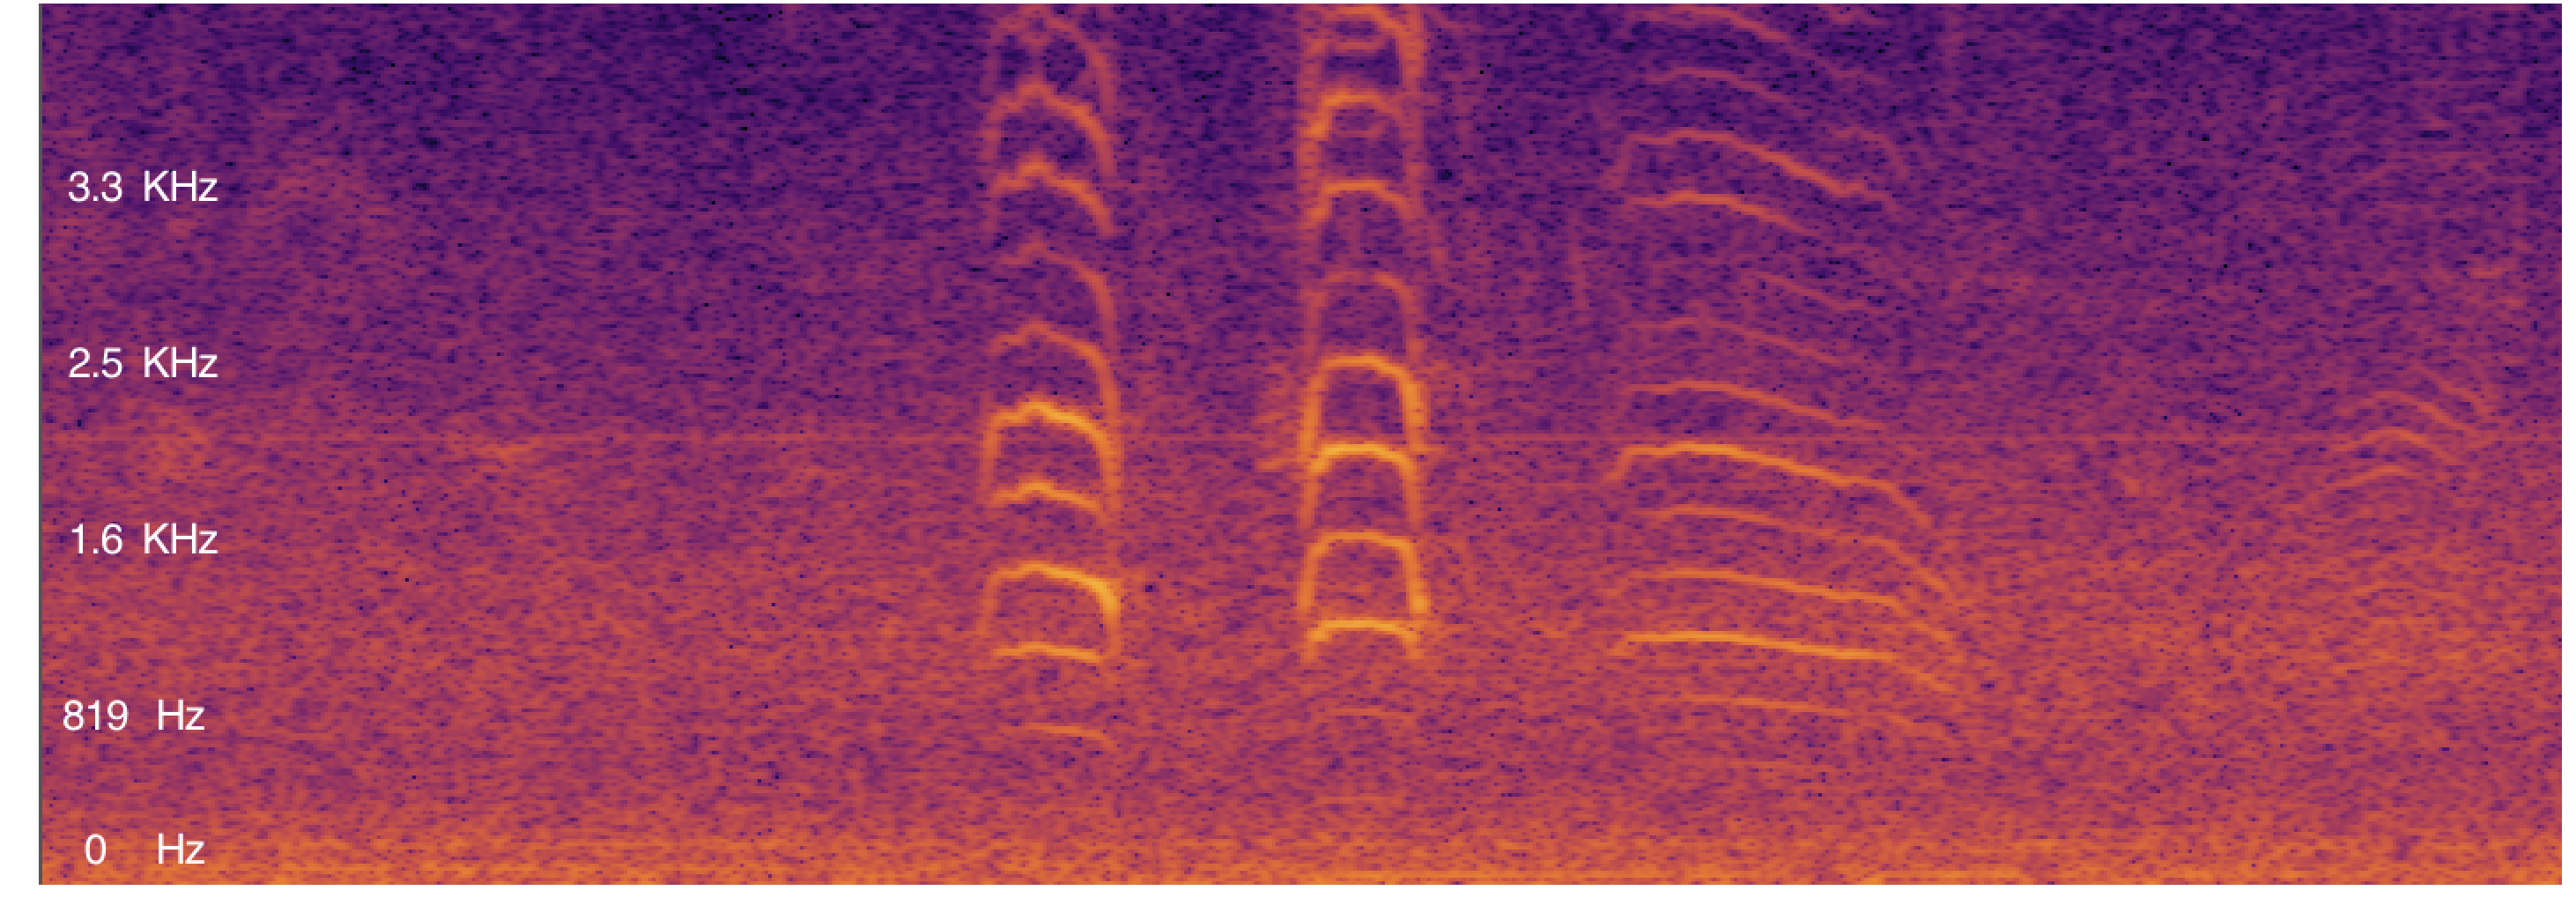
Example of a spectrogram of a seagull:
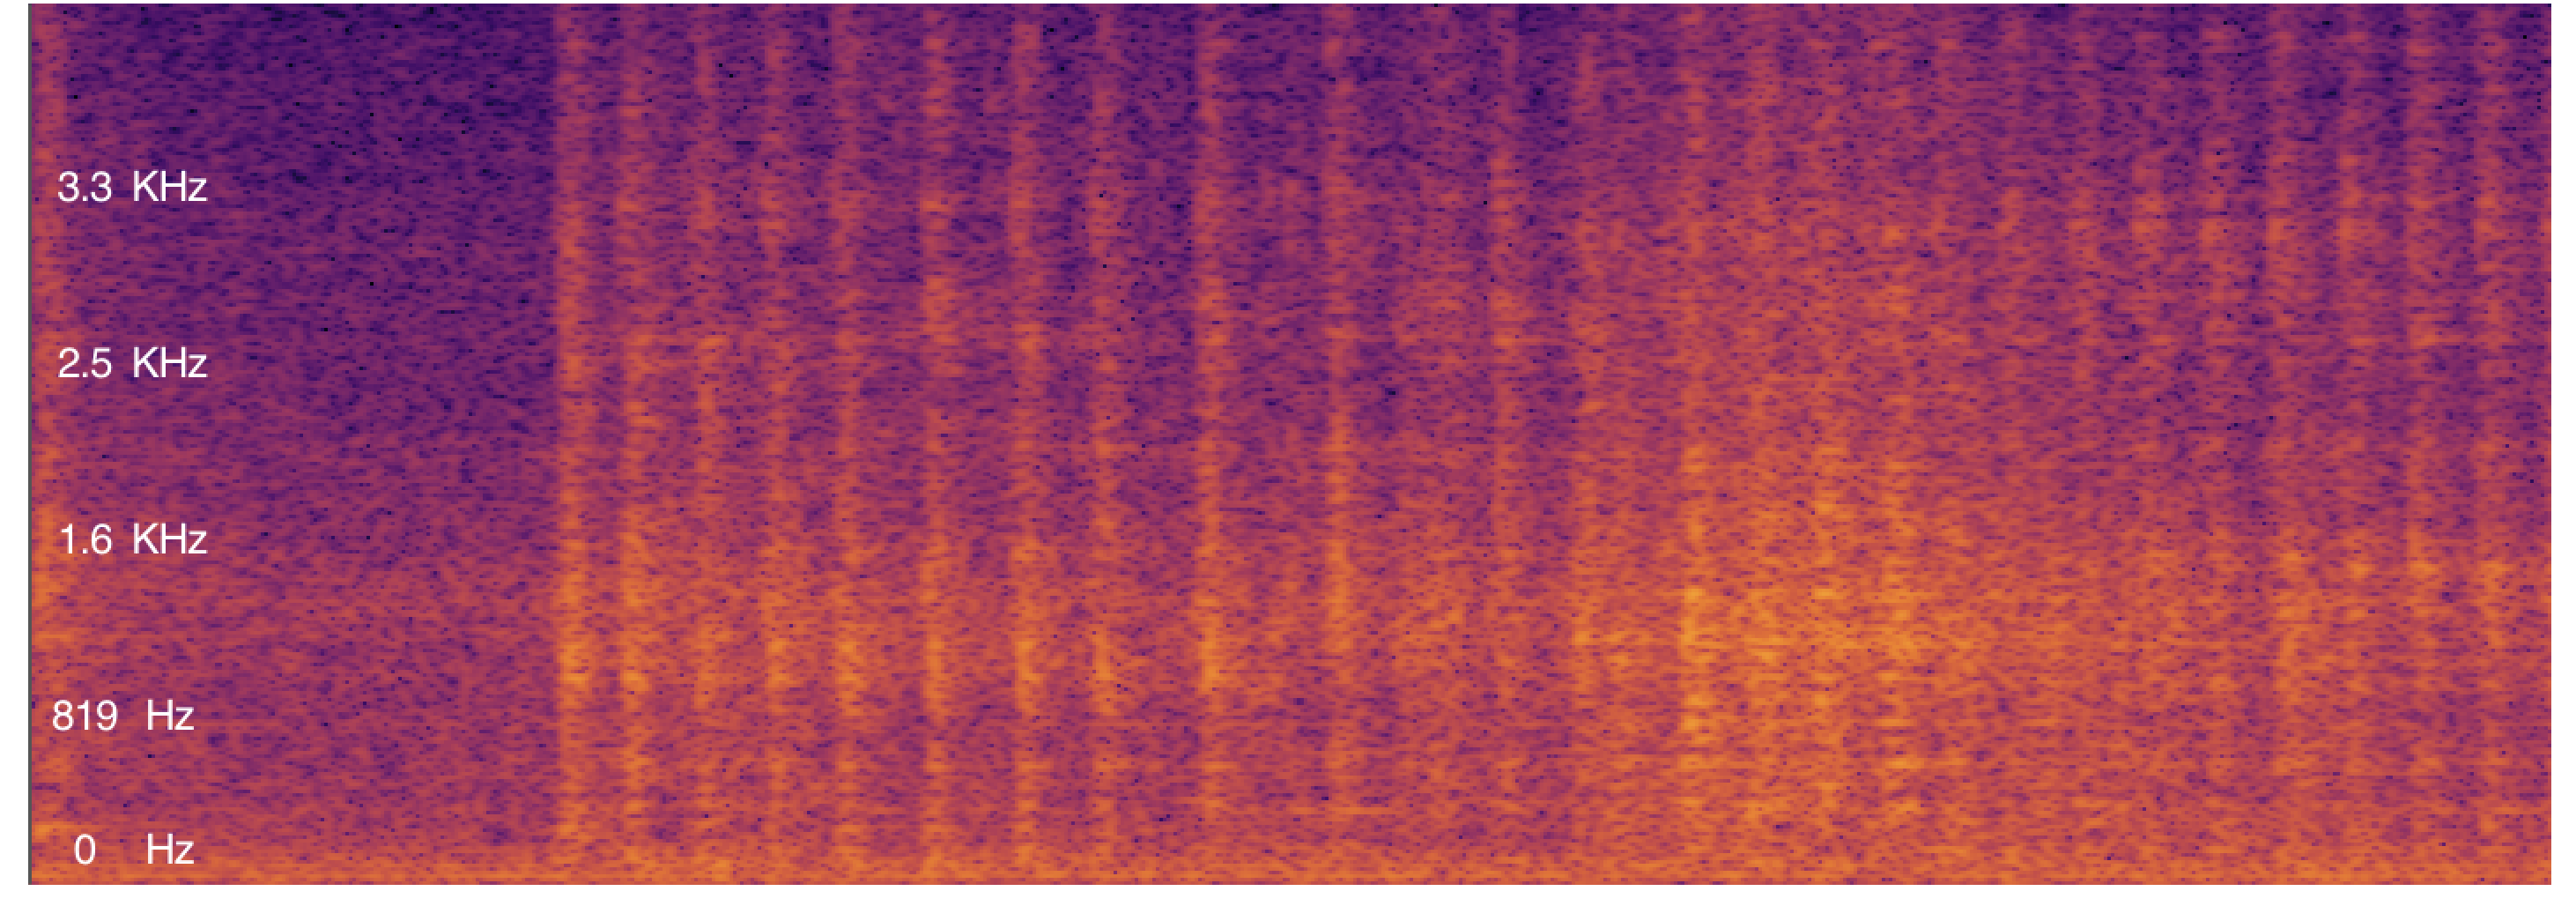
Example of a spectrogram of a hydraulic hammer:
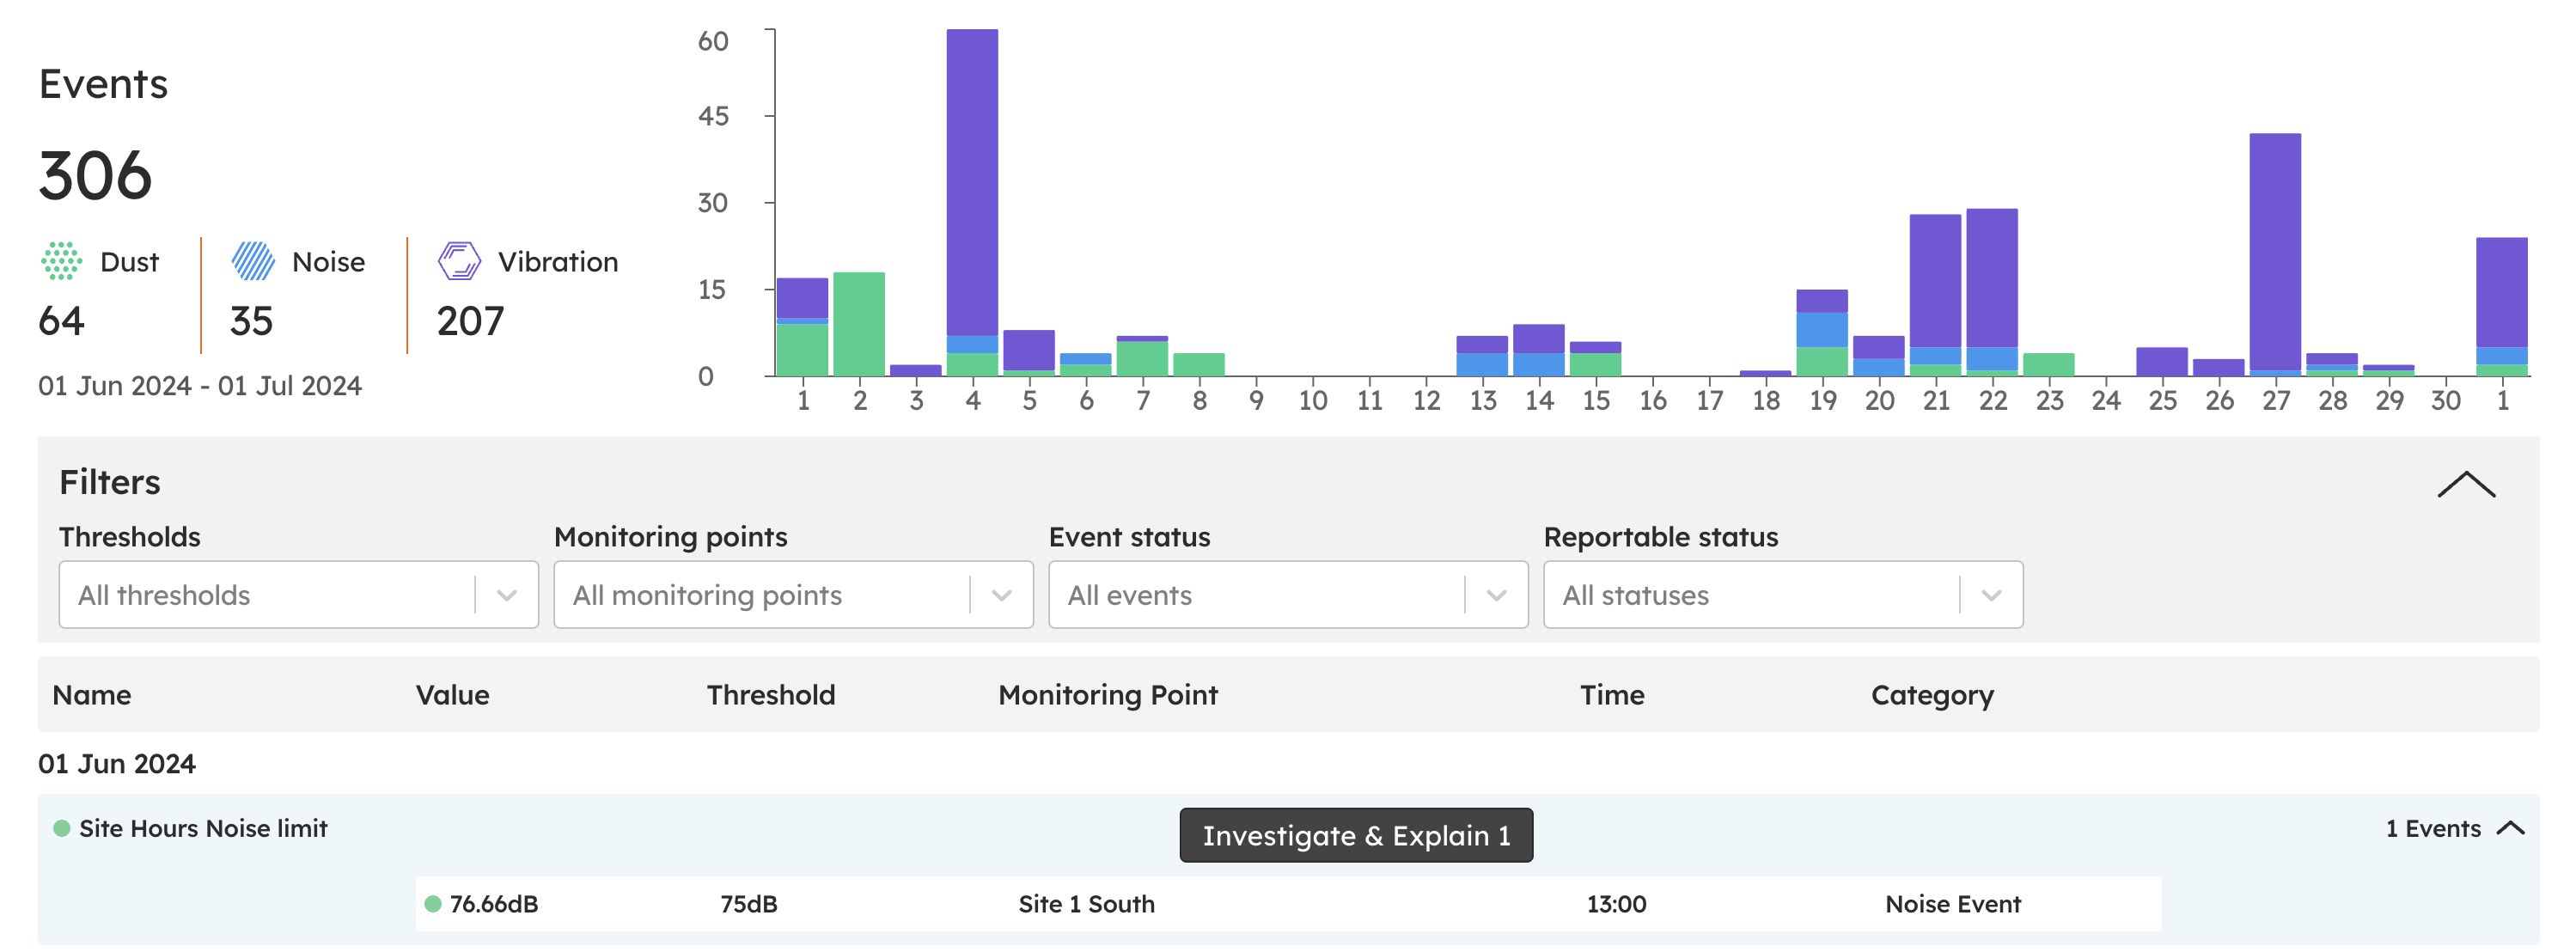
Media for Investigating Events
You can also see media and classifications on the events page:
Select Events page
Go to the 'Events' section and select an event you want to investigate.
Click the 'Investigate & Explain' button to see detailed information about the selected events.
If there is Media captured in proximity to the time of the event it will be shown, and can be clicked to reveal the media details: Image, DoA & Spectrogram like on dashboard.
Boost your noise management strategy
Let SiteHive Hexanode devices listen to your site while you focus on proactively controlling and reducing noise.
SiteHive Enviro Pro does the core work for you:
Records all noise exceedances, 24/7
Classifies the cause of noise exceedances in real-time
Sends a notification when a noise threshold is exceeded
Provides reporting with sound labels, contextual audio and video recordings
And allows you to focus on and control the more important things:
Pro-actively take action to reduce noise generated by your site
Keep stakeholders informed with easy-to-share and easy-to-read reports
Respond to community complaints swiftly with backed-up contextual information
The SiteHive Enviro Pro Audio Classifier is a powerful tool that enhances site monitoring and compliance reporting. By automating the identification and categorisation of noise exceedances it saves time and allows you to focus on proactively managing and reducing noise on your site.